Beta Trade effort for impact with Runway’s AI analyst

Turn data into powerful storytelling

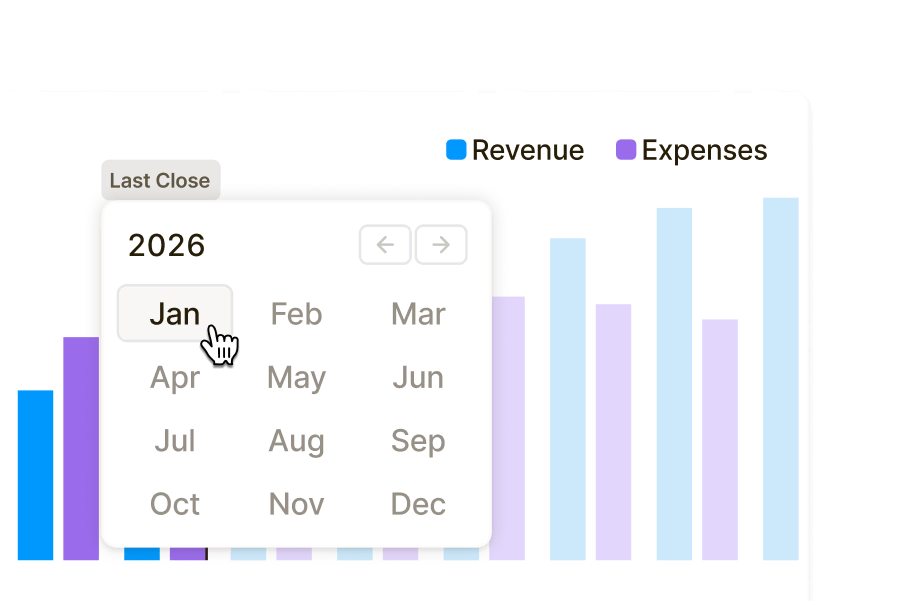
Skip the late nights in spreadsheets or last-minute deck building. Runway's automated dashboards and charts update in real-time, so you can focus on shaping the story behind the numbers.

End-of-year report dashboard comparing actuals vs budget for revenue, operating expenses, and net income, with variance analysis below.

Stop building reports. Start telling stories.

Your stakeholders don't want another static deck. They want to understand what's happening and why. Runway automates the mechanics of reporting, so you can deliver the insights that matter.

  • Bar chart of revenue and expenses by month with a calendar popup selecting August 2025. ‘Last Close’ label highlights financial close workflow.

    Month-end close

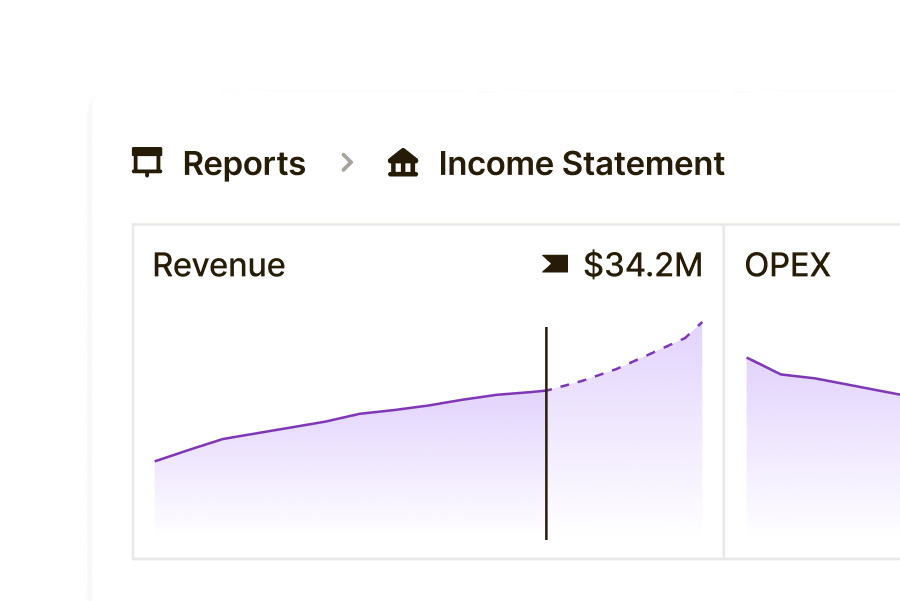
    Close books in minutes, not days. Roll over actuals with one click, auto-reconcile accounts, and generate reports instantly.

  • Revenue chart in an income statement report, showing actual vs projected performance with a solid and dashed line. Revenue total of $34.2M displayed.

    Interactive dashboards

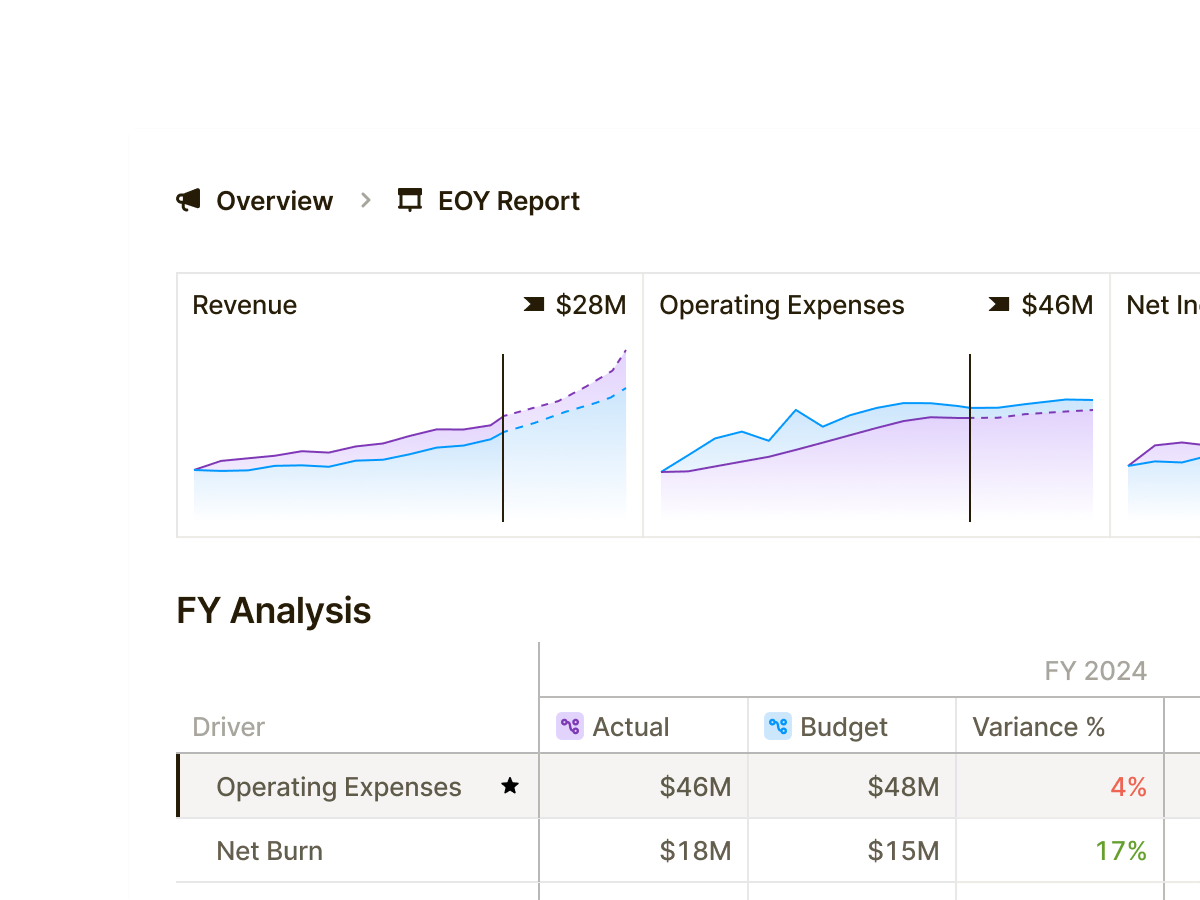
    Give stakeholders dynamic reports they can actually use. Share custom views, embed live charts, and let viewers explore data without breaking formulas.

  • Variance analysis table comparing FY close and FY budget for revenue and OPEX, including color-coded percentage variances.

    AI variance analysis

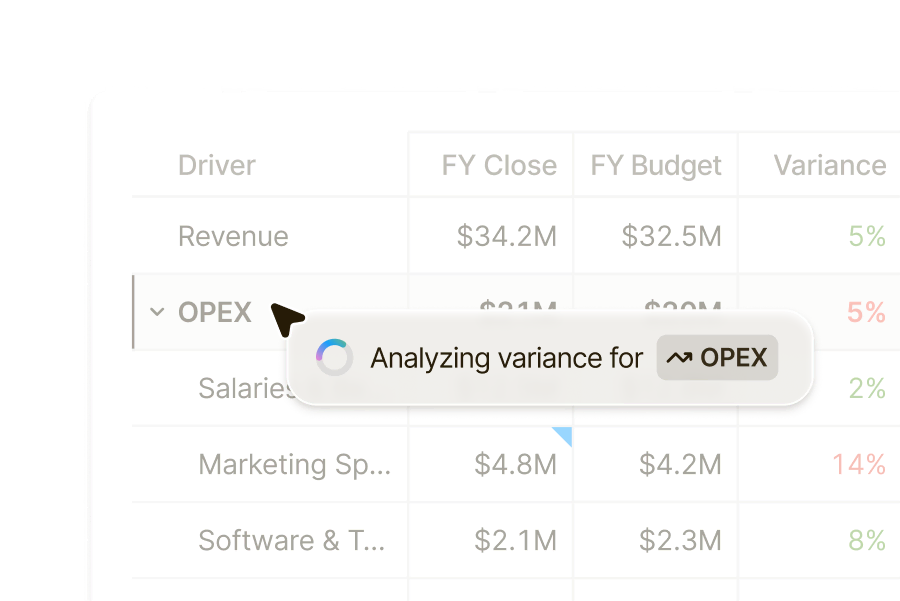
    Spot discrepancies instantly. Compare budget vs. actuals across any period, and drill down to the exact drivers behind every shift.

  • Sync status dropdown for QuickBooks integration showing healthy sync at 7:00 AM, with options to resync or update login info.

    Real-time data sync

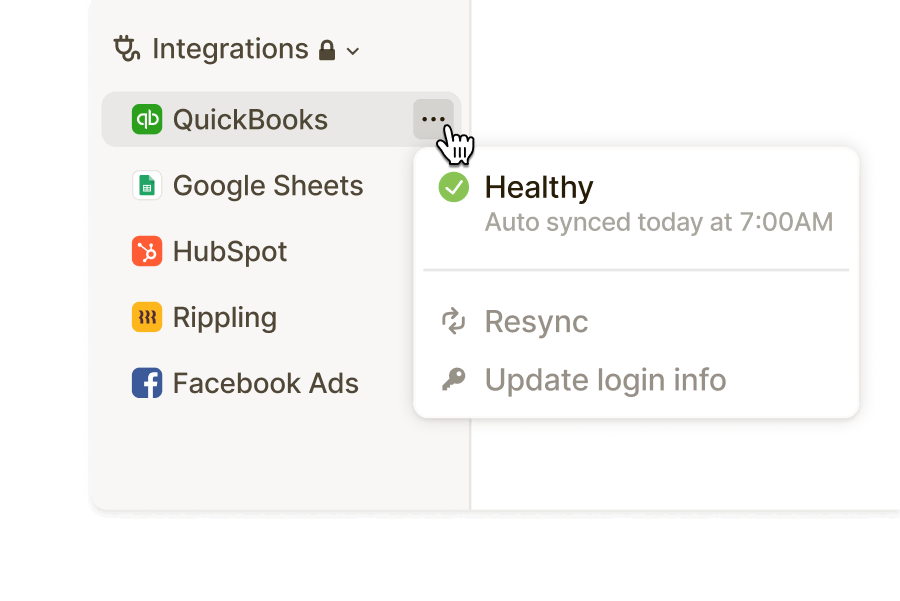
    Always work from the latest data. Pull in your actuals from your systems with one click. No more exports or copy-paste errors.

Tell the right story, every time

Runway turns financial reporting into a source of truth your team can trust, and a story your business can act on.

  • Board and investor updates
  • Department budget reviews
  • Executive business reviews
  • Quarterly earnings preparation
  • KPI tracking and alerts
Board update draft with inline metrics and a dropdown to insert the ‘Cash’ driver into the text.
“In Runway, we have a link that anyone outside the finance team can use to check the metrics we’re hyper-focused on. It’s clean and real-time, and gets the attention back on the actual business. And that’s what really matters—getting the business answers right, instead of wasting time building reports.”

Other teams doing finance better

How Rootly found clarity and confidence in decision-making cover image
SaaS

Finding clarity and confidence in decision-making

100% automated reports
How Mainspring scaled finance, sales, and ops — with clarity, and speed cover image
Fintech

Scaling finance, sales, and ops — with clarity, and speed

6x faster scenario analysis
How Tixel simplified multi-entity forecasting to make more confident decisions cover image
Marketplace

Easier multi-entity forecasting, more confident decisions

23+ Spreadsheet versions consolidated

Trusted by fast-moving teams

Frequently asked questions

Tell the story behind your numbers

Discover how Runway brings data, narrative and context together to create clarity for everyone.

Book a demo