Charts are easier to read and reset
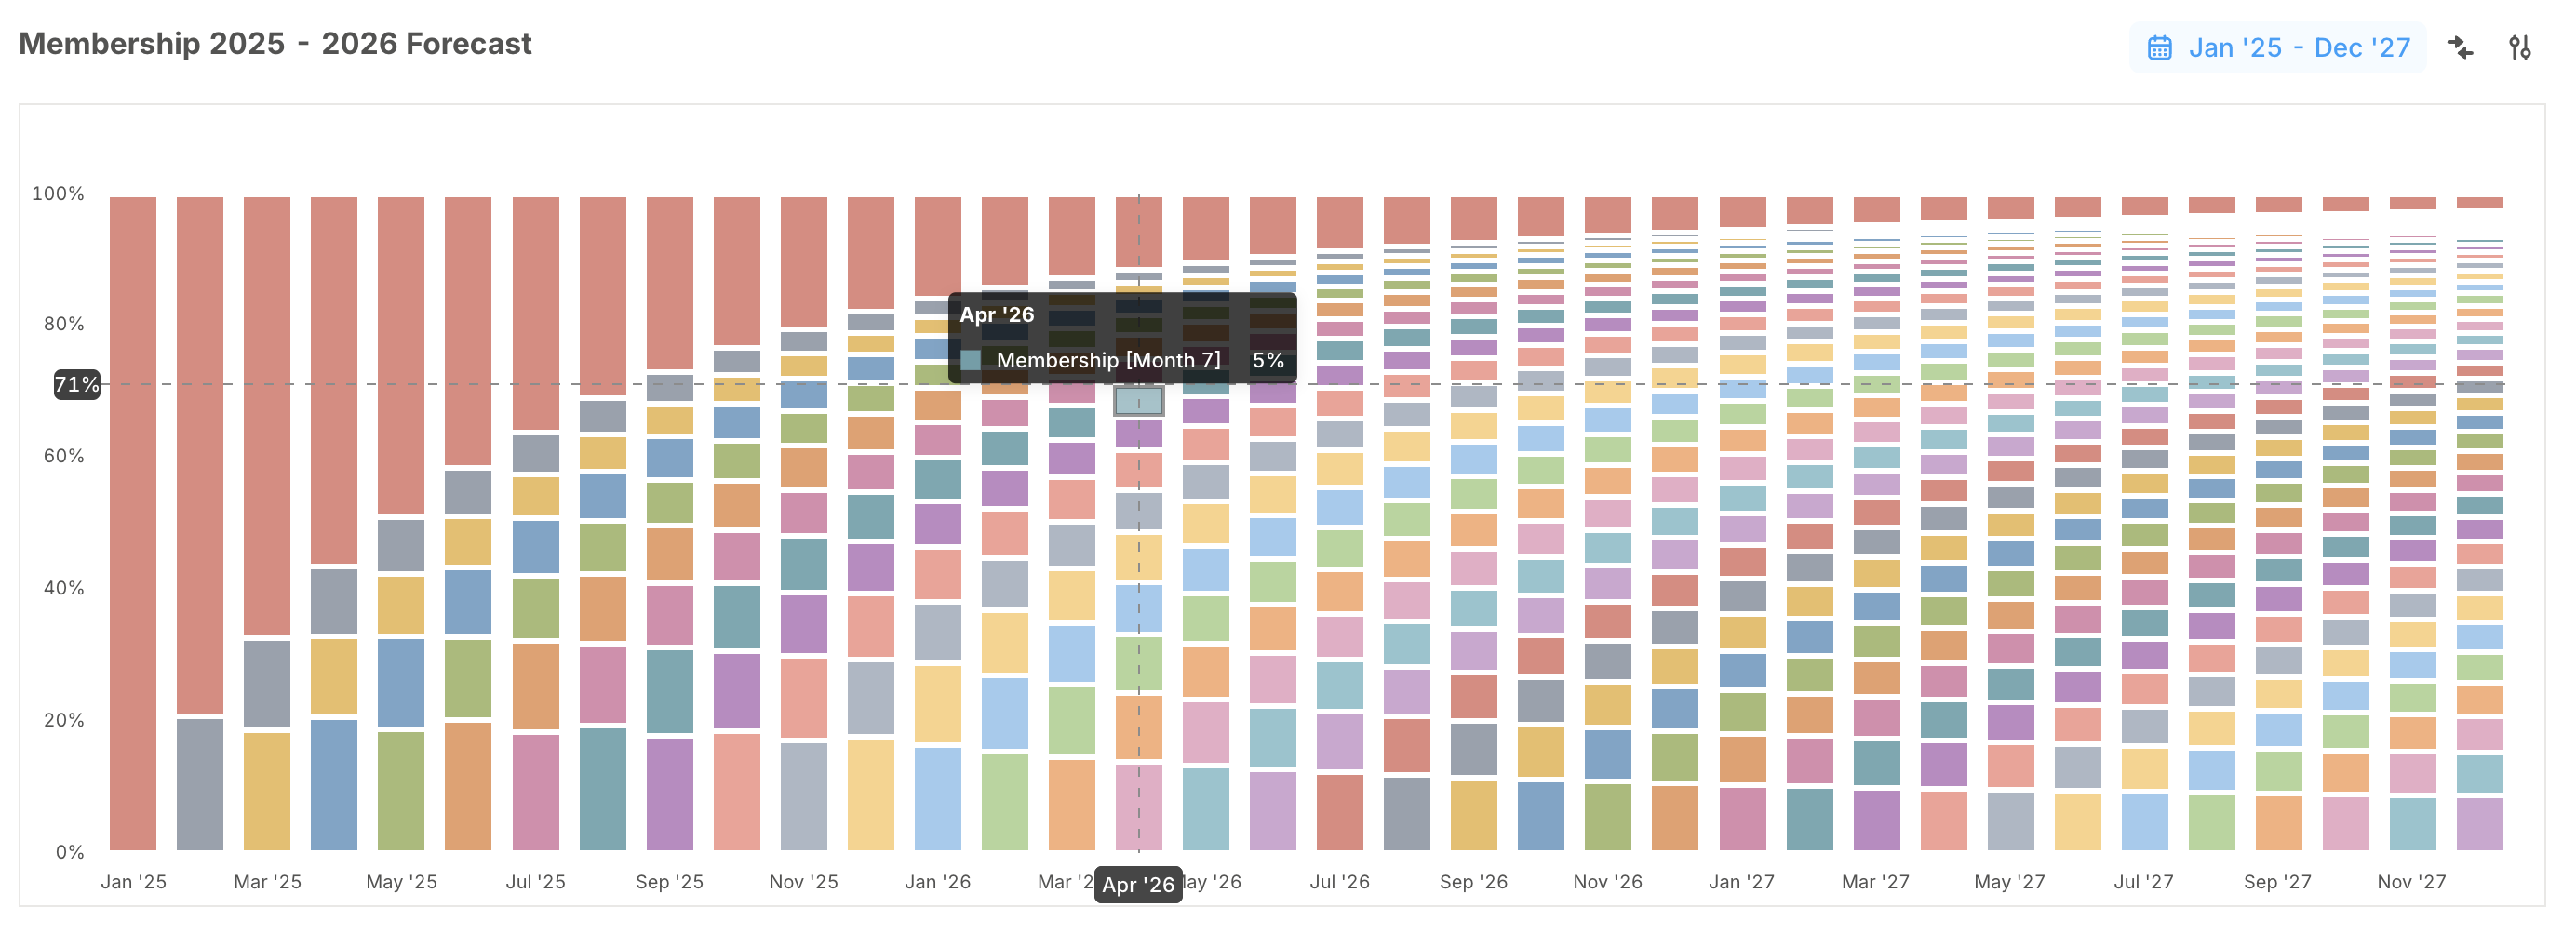
100% stacked charts now display percentages everywhere, including tooltips, axis labels, crosshairs, and on-chart data labels. So instead of seeing values in a percentage-based chart, you see the share each segment represents.
We’ve also added Reset Chart configuration in the Advanced settings menu. If a chart gets over-customized, one click restores it back to clean defaults based on the underlying table, without rebuilding it manually.
Small changes, big impact
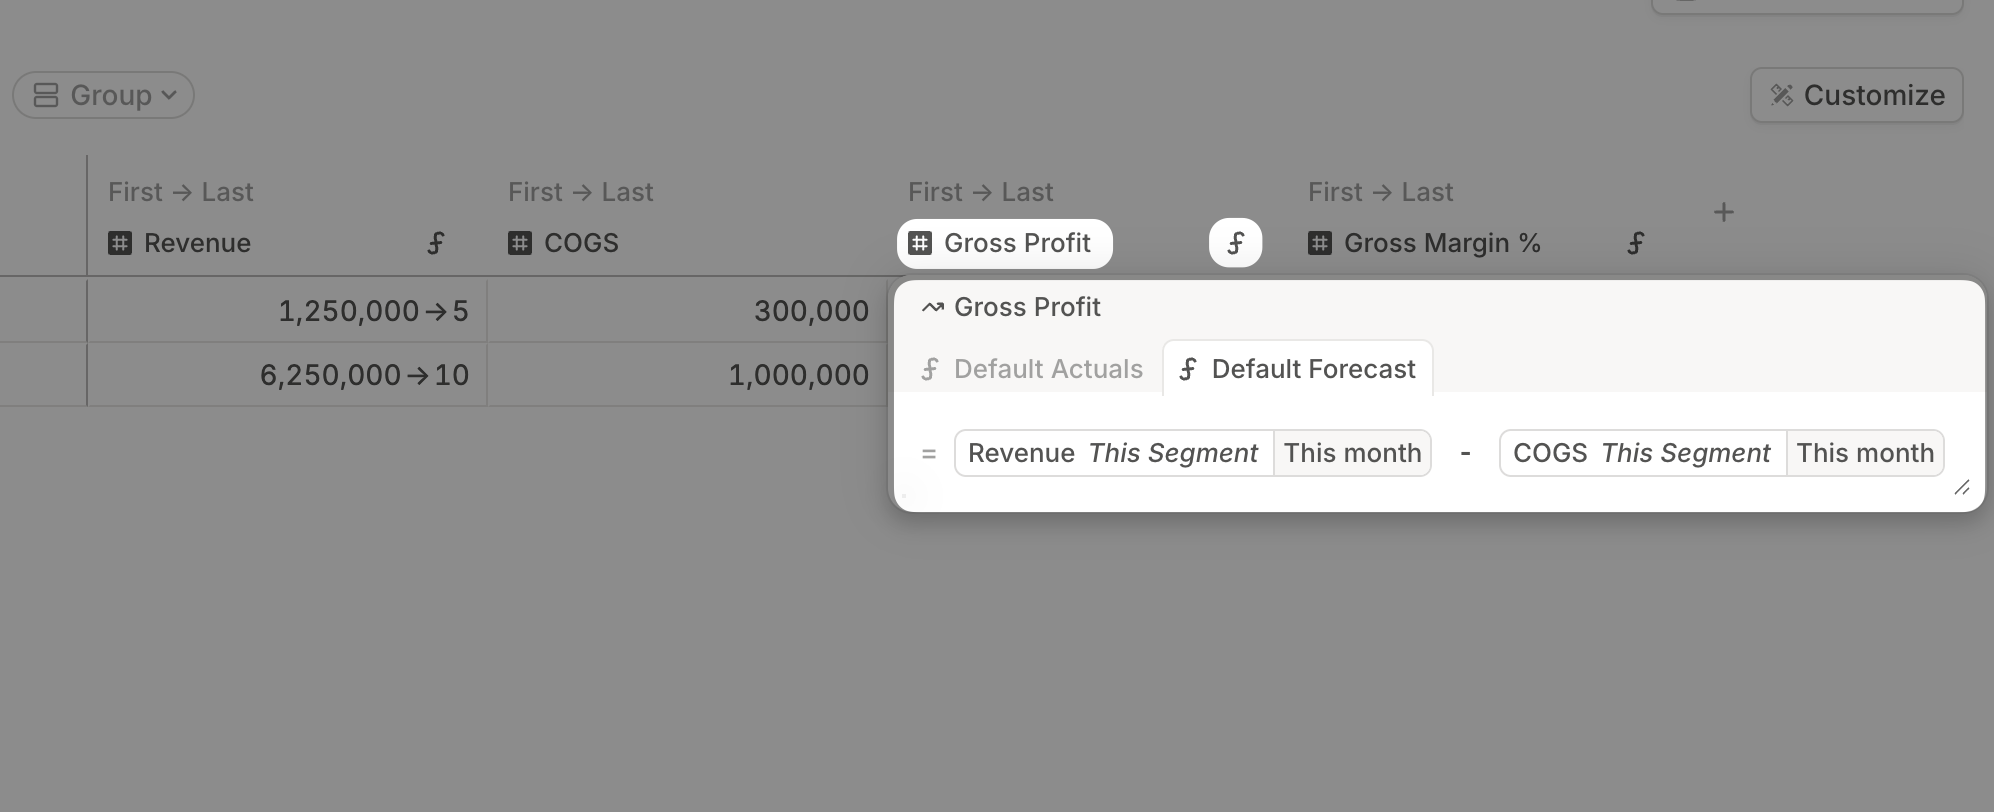
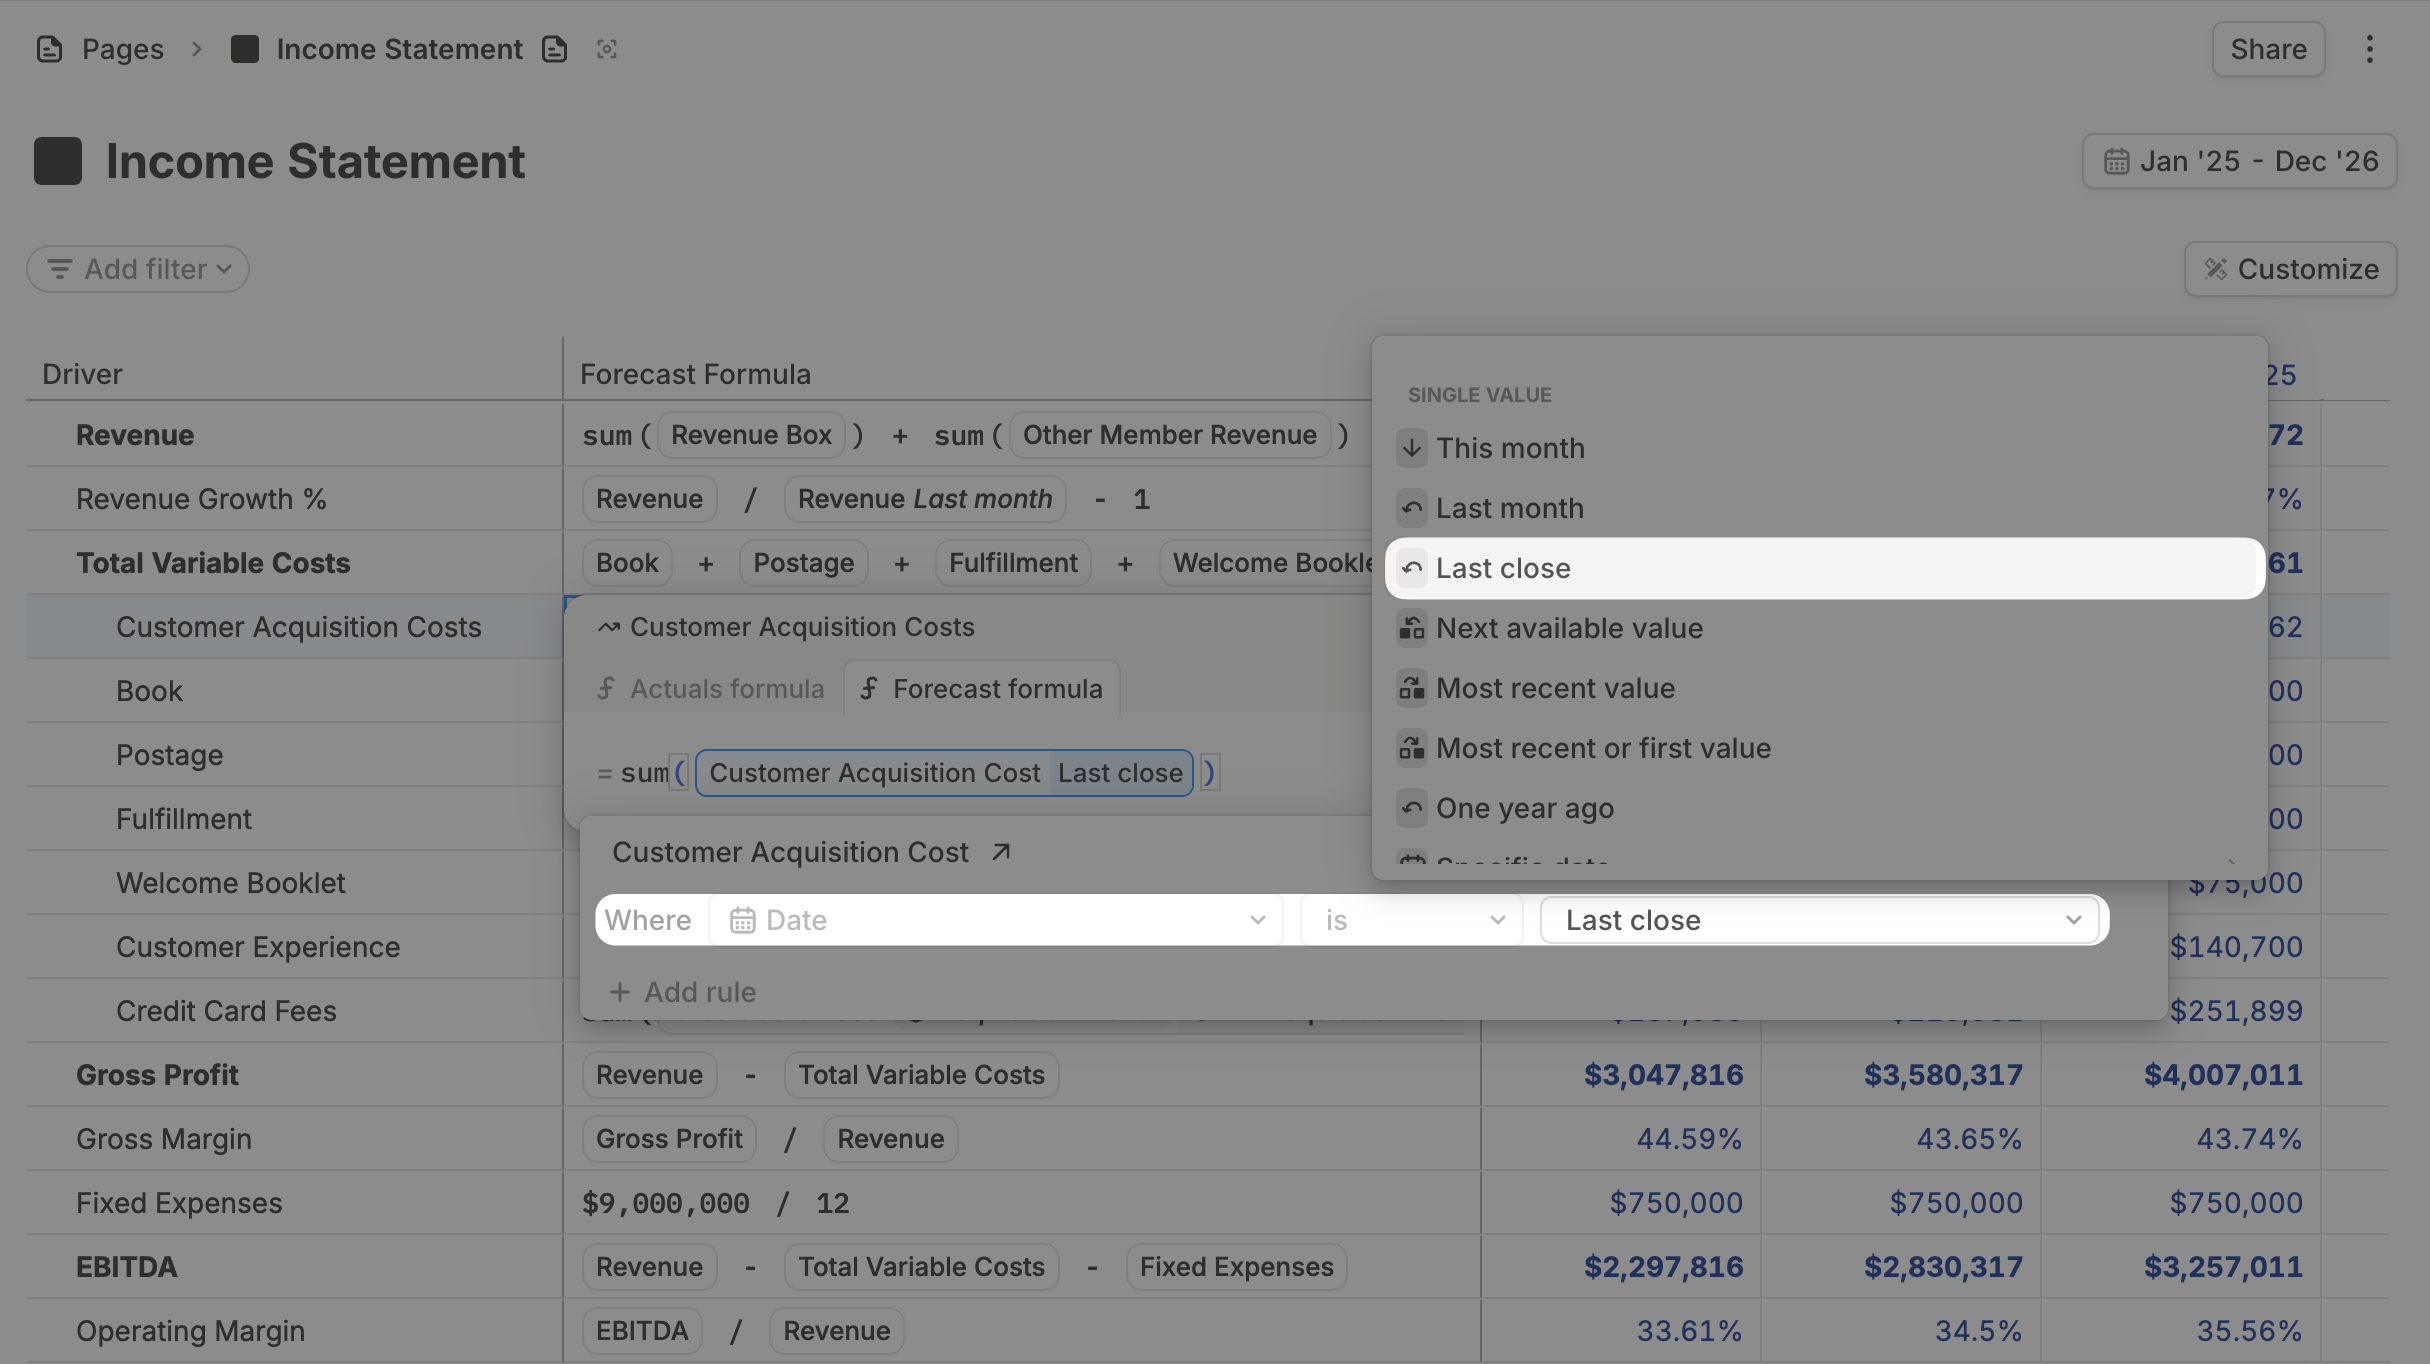
- Smoother formula editing: Keystrokes in the forecast formula editor behave as expected, draft history stays intact when formulas change, and default formulas can be added after renaming a database column.
- Clearer text blocks: Improved typography creates a cleaner content hierarchy on pages.


Comments now support hyperlinks
Add source material and context directly into your notes, without leaving Runway. Links to docs, Notion pages, Slack threads, or anything else are now clickable right from the thread.
We’ve also added a resolved view in the comments menu, so past decisions stay accessible without cluttering active discussions.
Small change, big impact