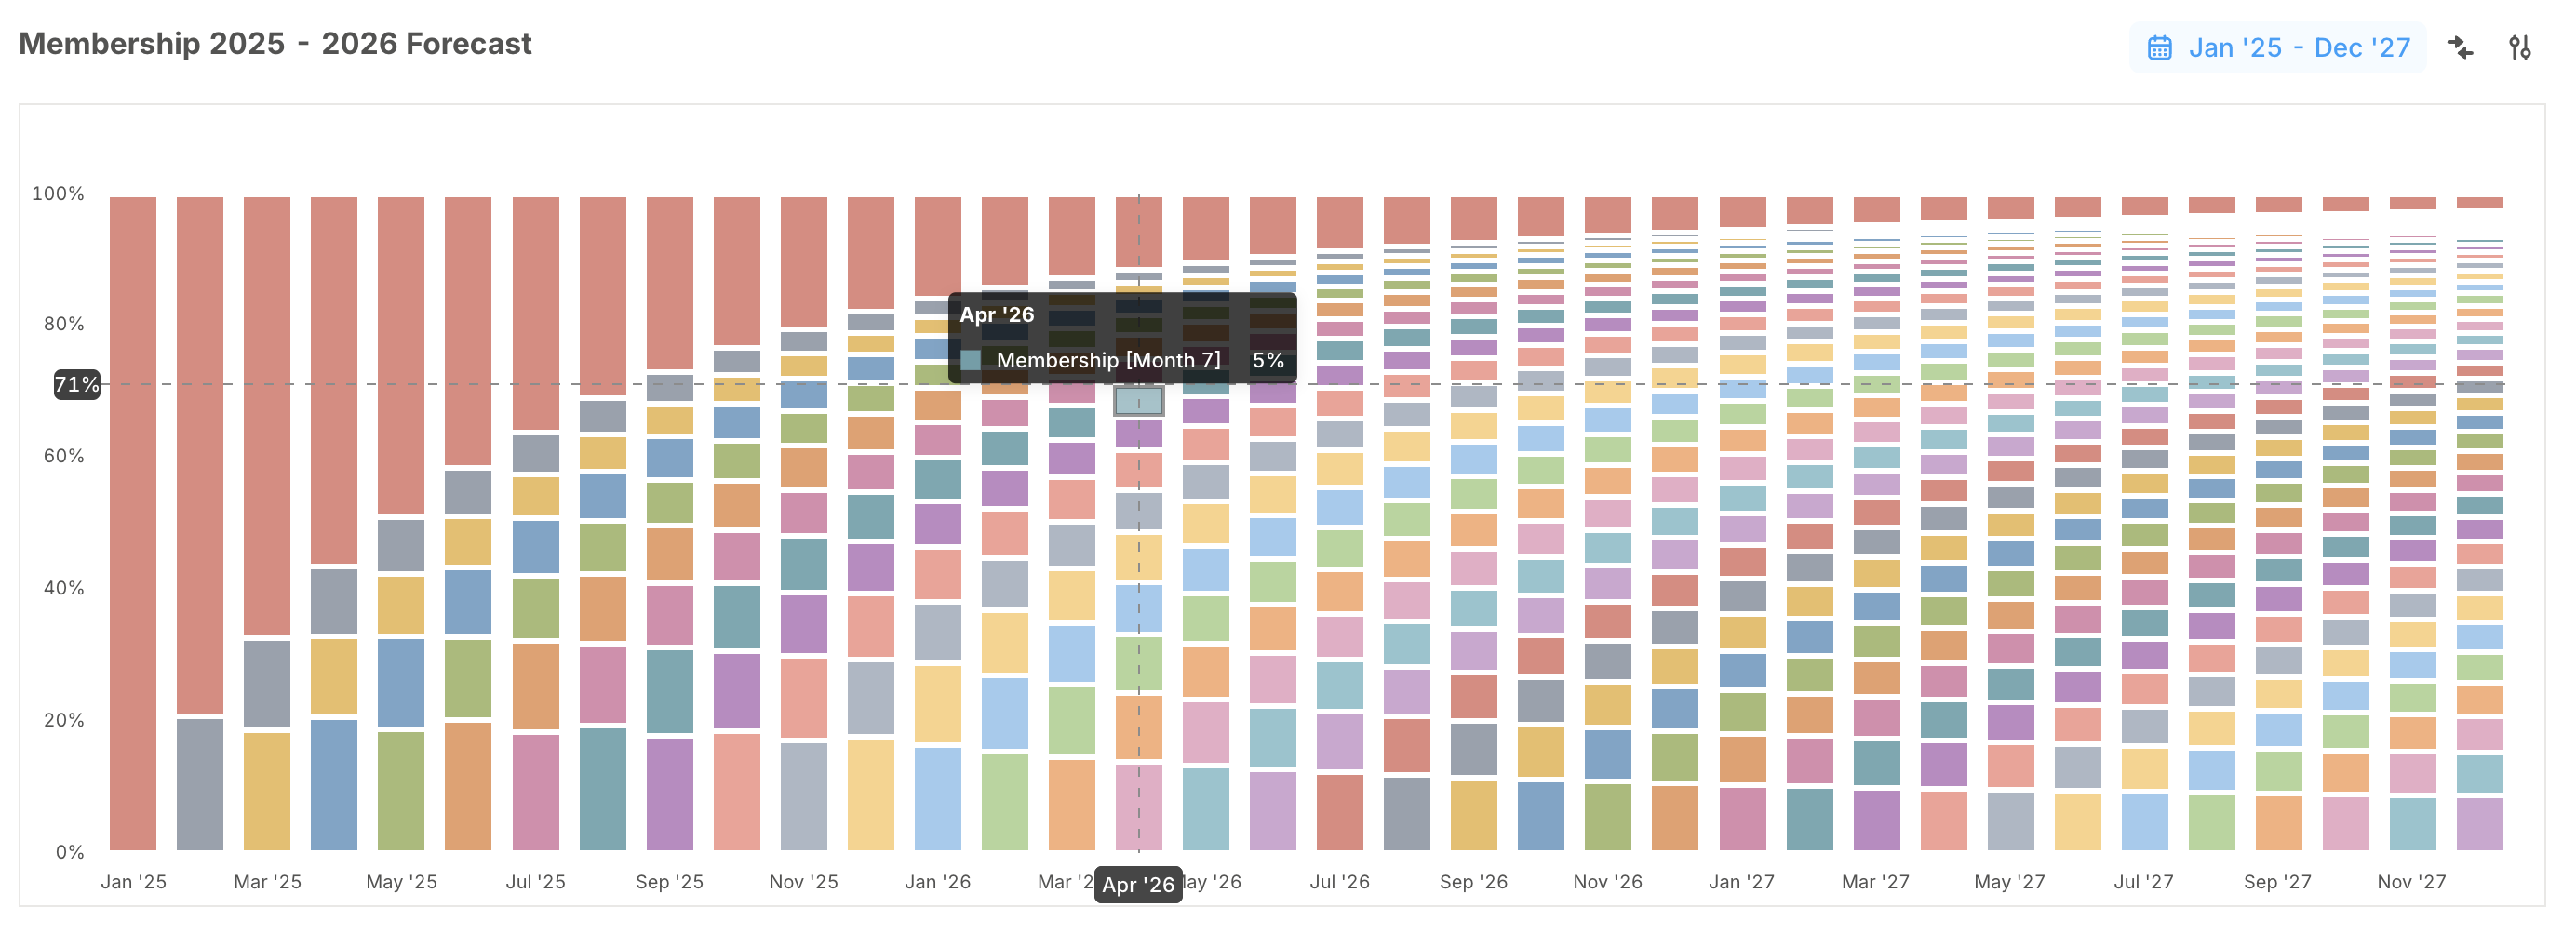
100% stacked charts now display percentages everywhere, including tooltips, axis labels, crosshairs, and on-chart data labels. So instead of seeing values in a percentage-based chart, you see the share each segment represents.
We’ve also added Reset Chart configuration in the Advanced settings menu. If a chart gets over-customized, one click restores it back to clean defaults based on the underlying table, without rebuilding it manually.
Small changes, big impact
- Smoother formula editing: Keystrokes in the forecast formula editor behave as expected, draft history stays intact when formulas change, and default formulas can be added after renaming a database column.
- Clearer text blocks: Improved typography creates a cleaner content hierarchy on pages.