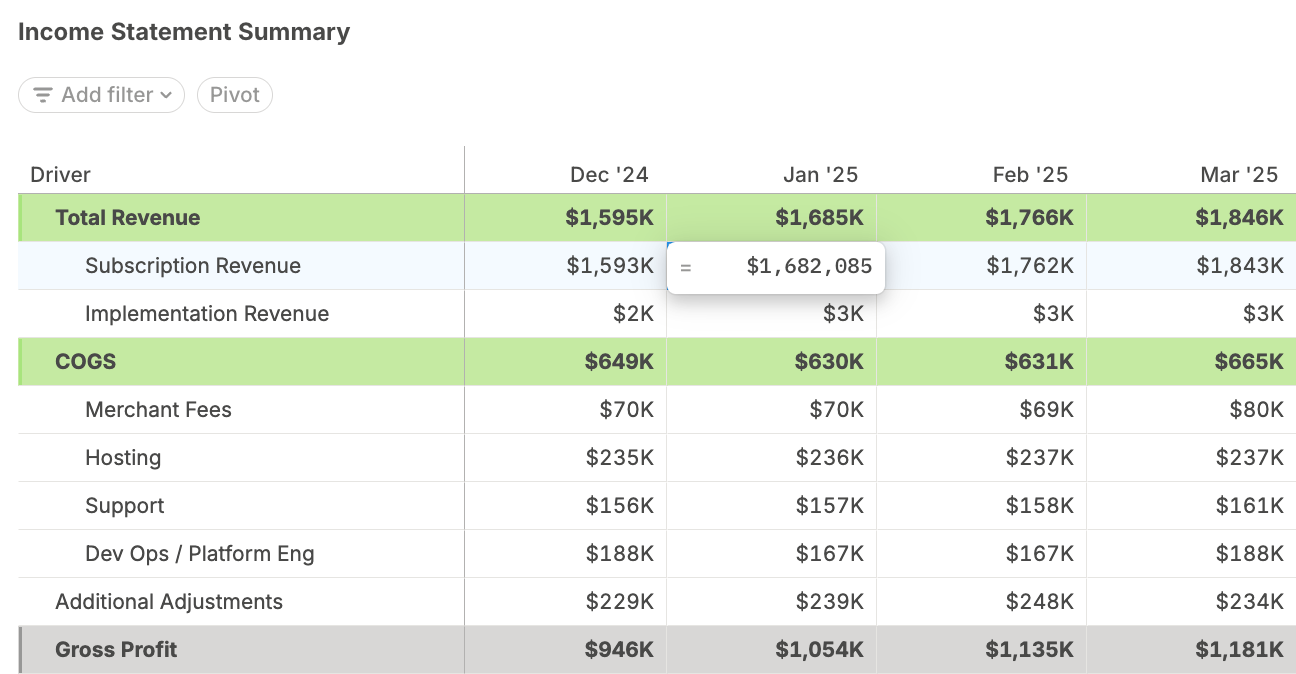
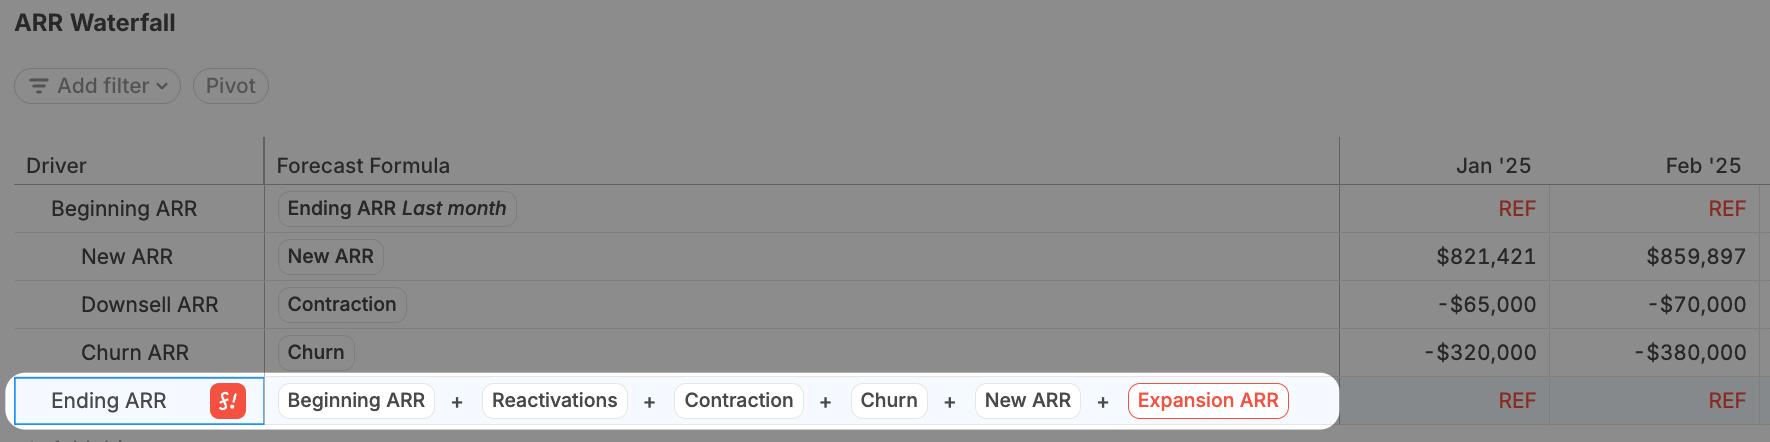
See your data right away with simpler drill-ins
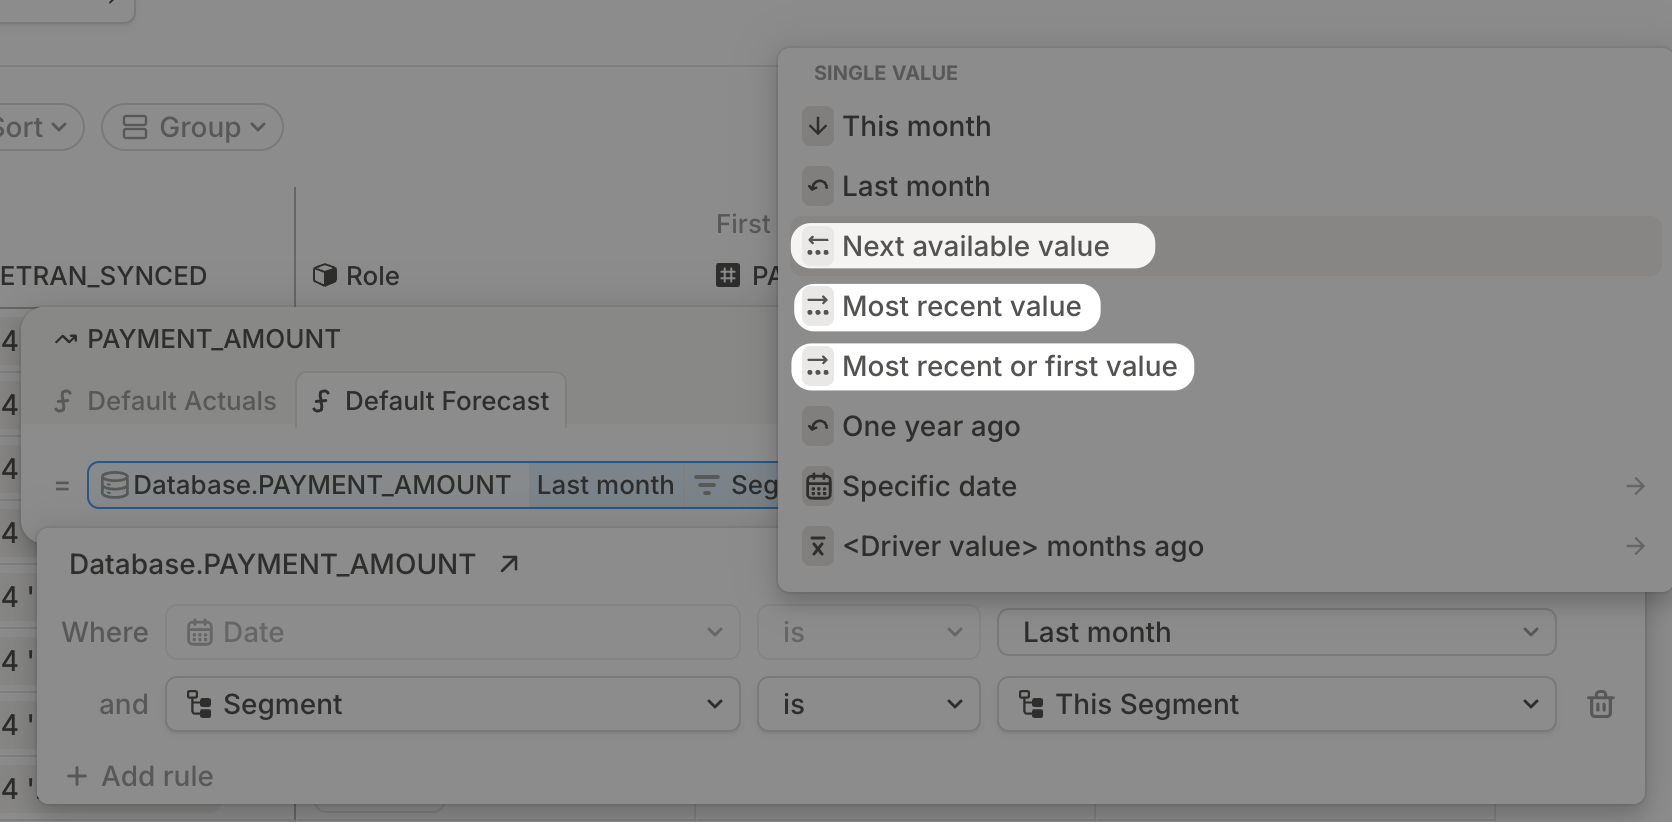
Drilling into a driver now takes just one click.
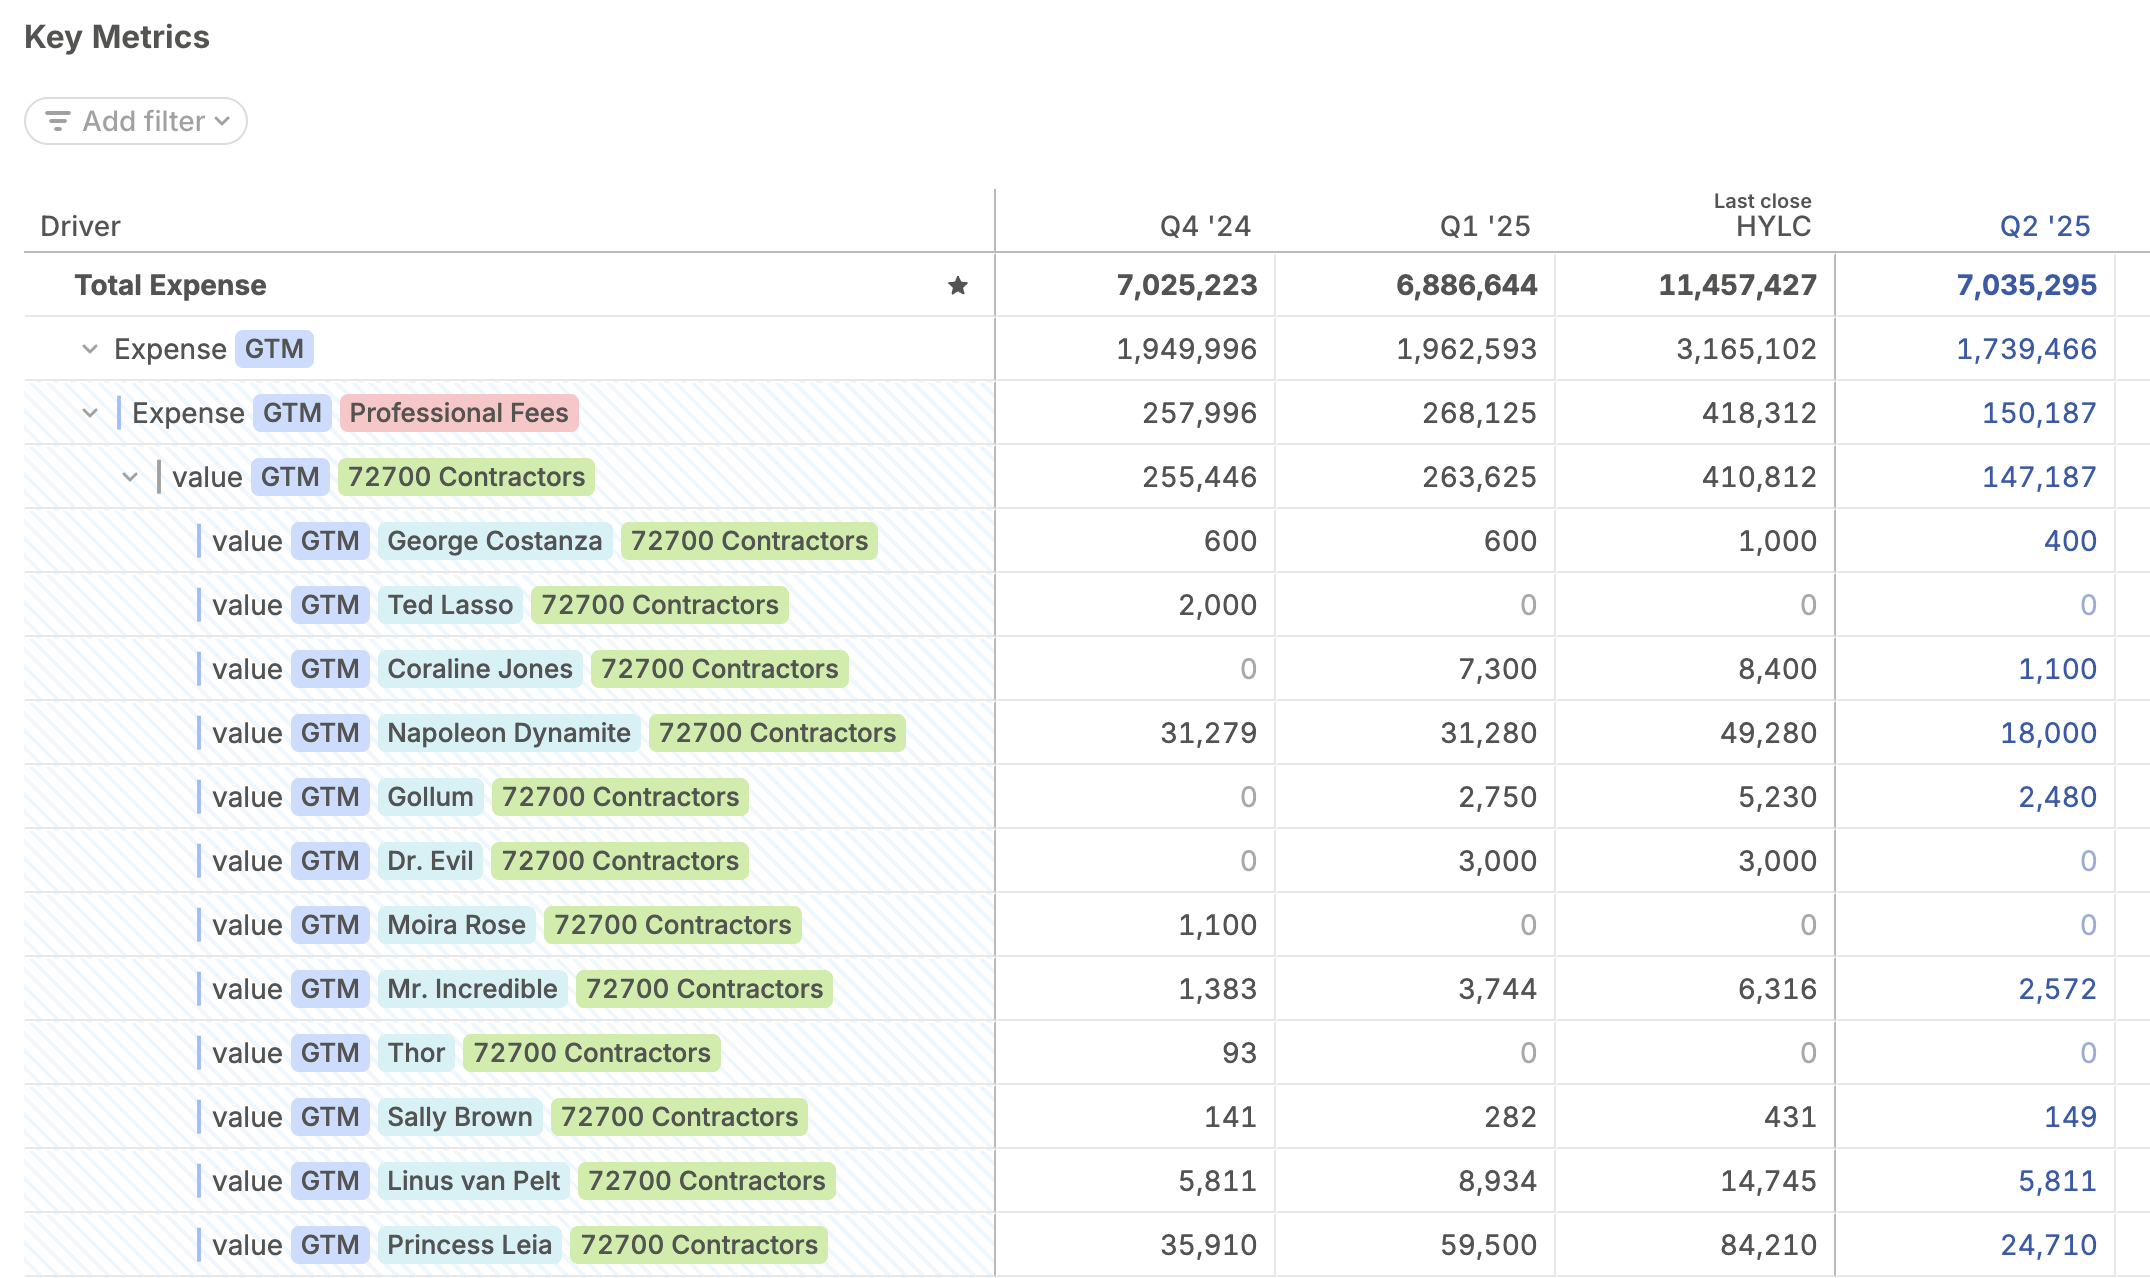
If a driver pulls from a single database, Runway shows you the underlying rows immediately, so you can see exactly where the numbers come from.
If a driver pulls from multiple databases, we’ll group by source to keep things clear.
Small changes, big impact
- Format values as multiples, showing
10.0xinstead of10.0. - Time period comparison charts pull the right date range automatically. No manual tweaks required.
- Large number abbreviations now display properly in comparison charts.