Block resizing. Exporting for all users.
Two highly requested upgrades, now live for everyone.
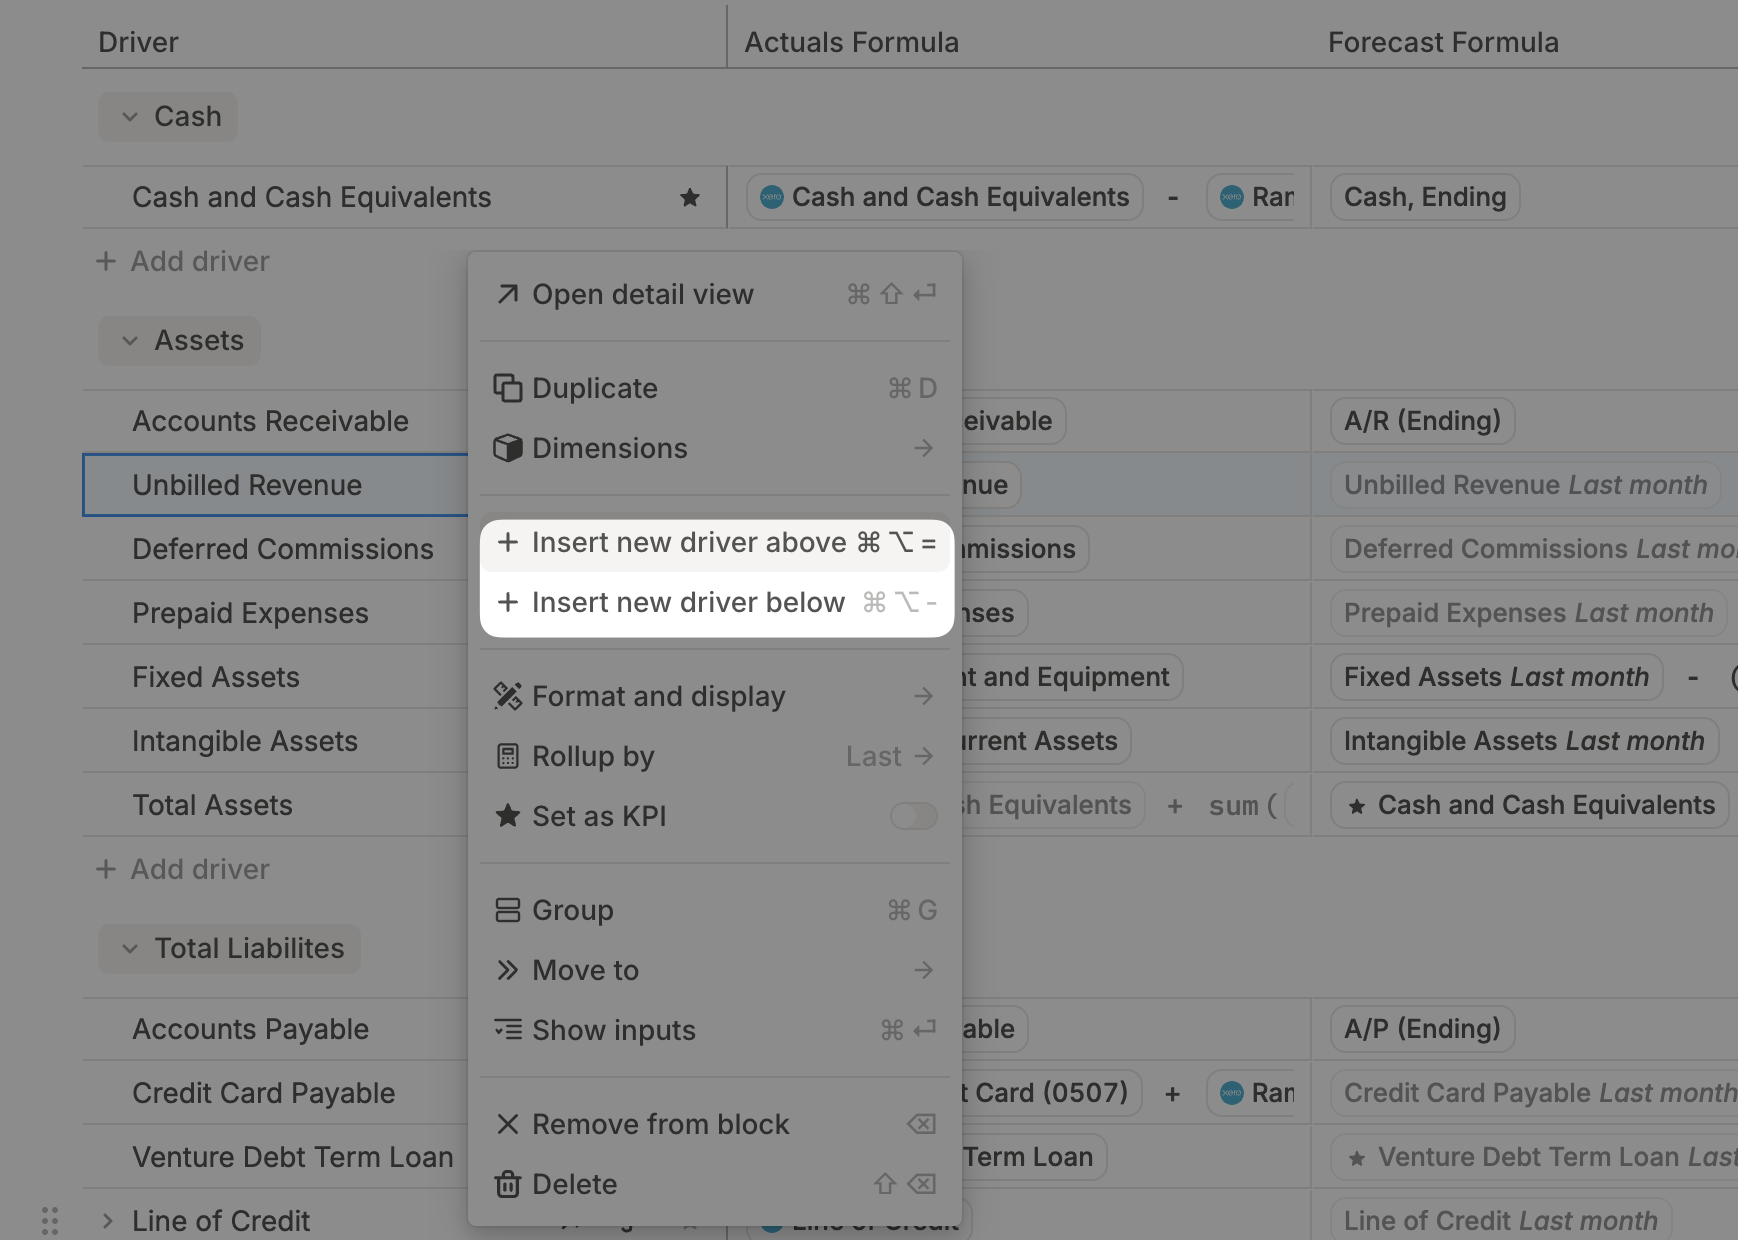
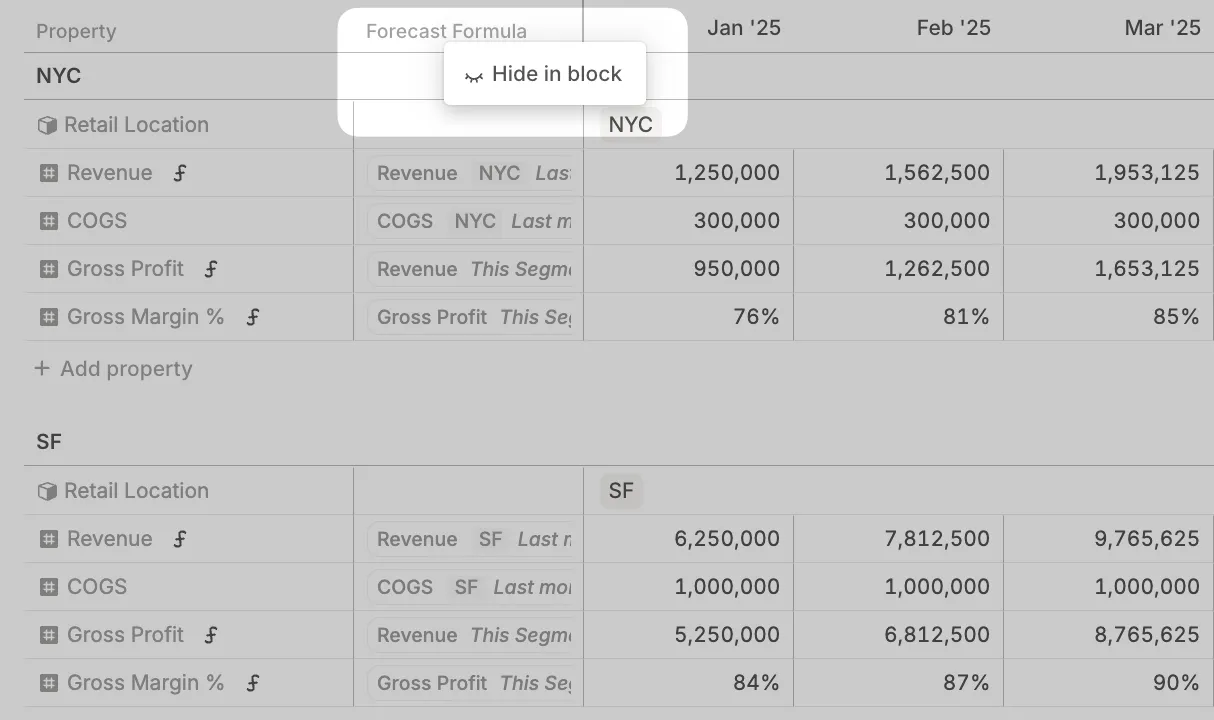
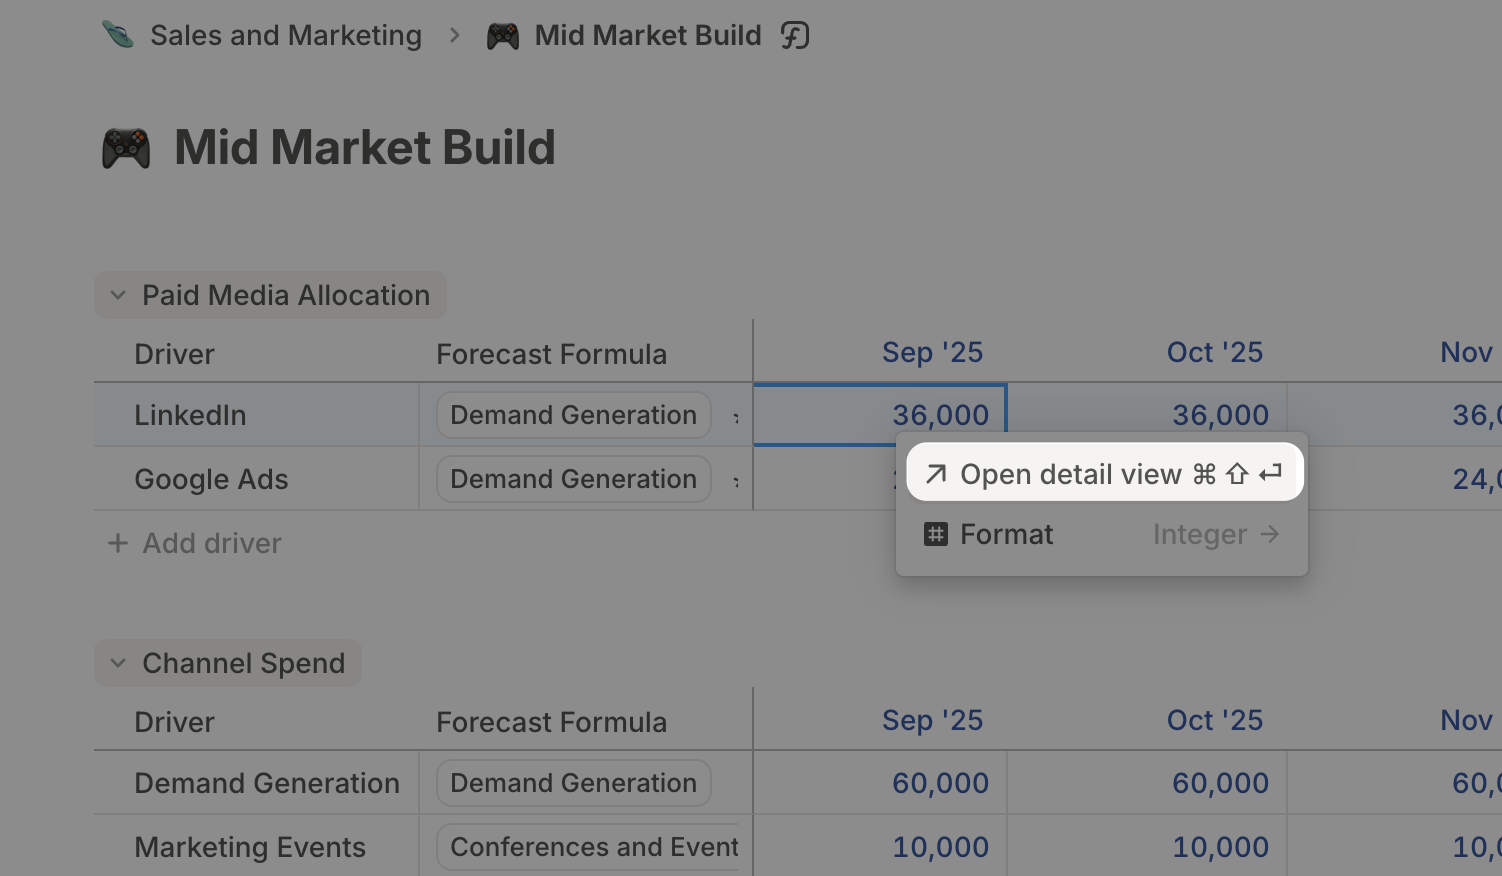
Drag to resize blocks on a page
Need more room for a driver label?
You can now resize blocks by dragging their edges, just like spreadsheet columns.
- Works when blocks are laid out side by side in the same row.
- Resize widths with a simple click and drag.
- No need to rebuild layouts or guess at proportions.
Makes it easier to tidy up pages, and see the information you need.
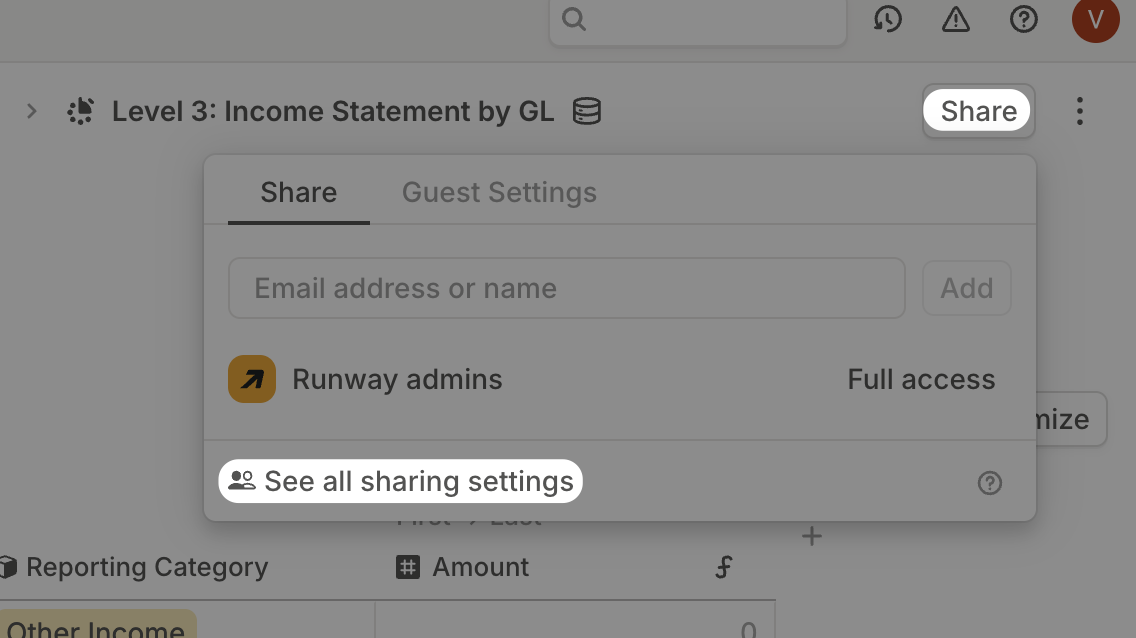
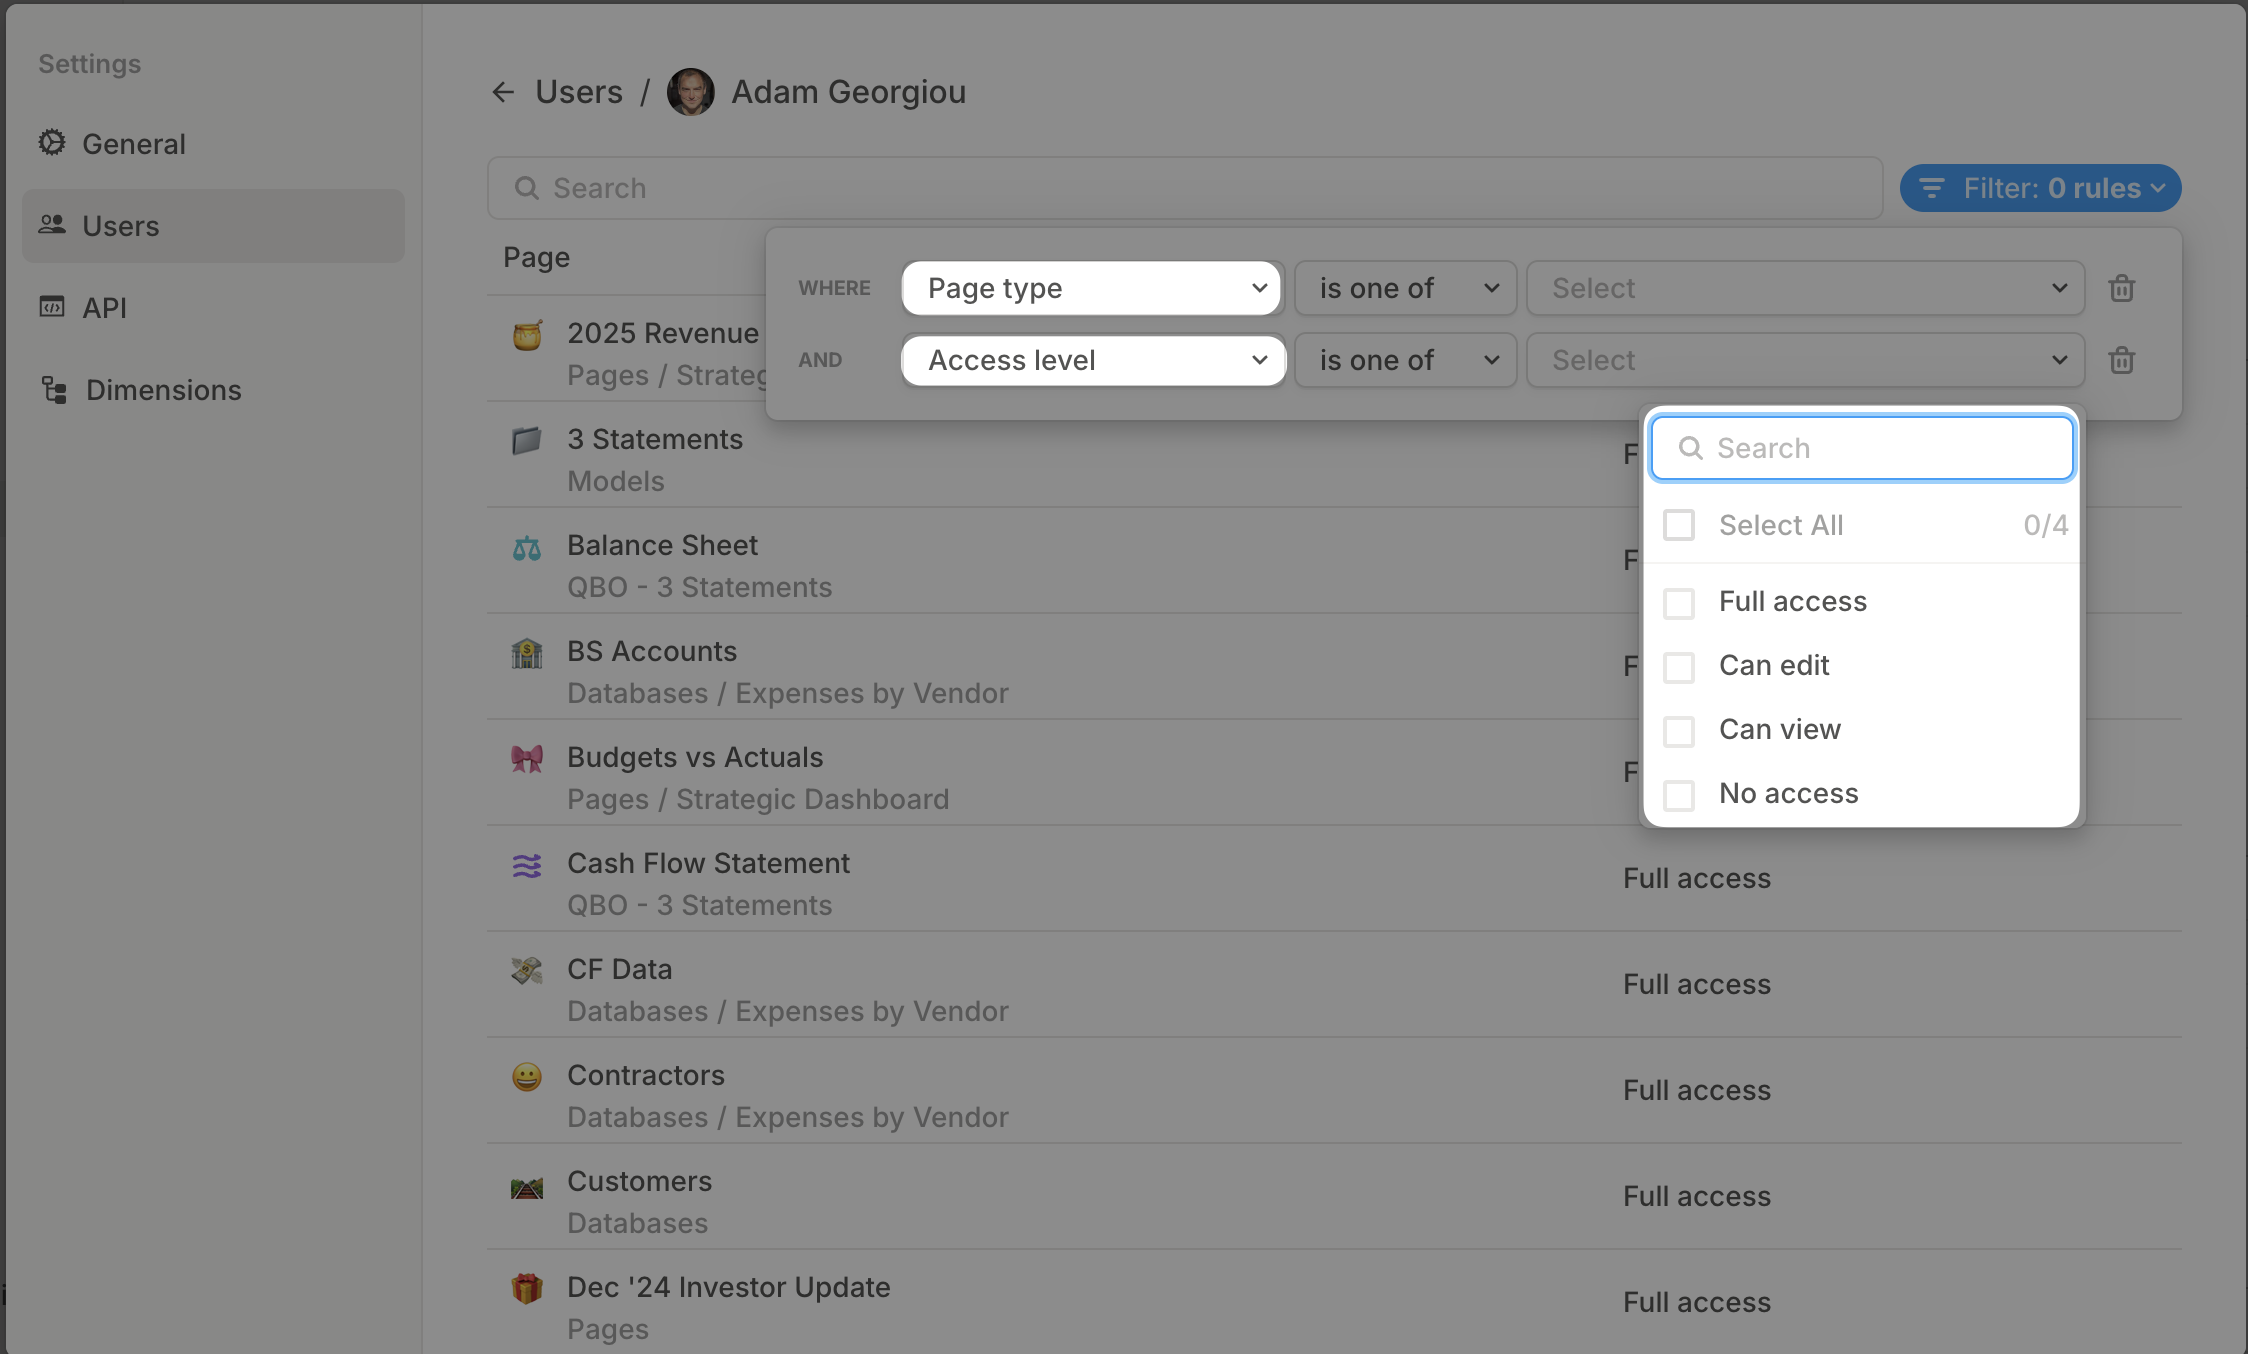
All roles can now export (with safeguards)
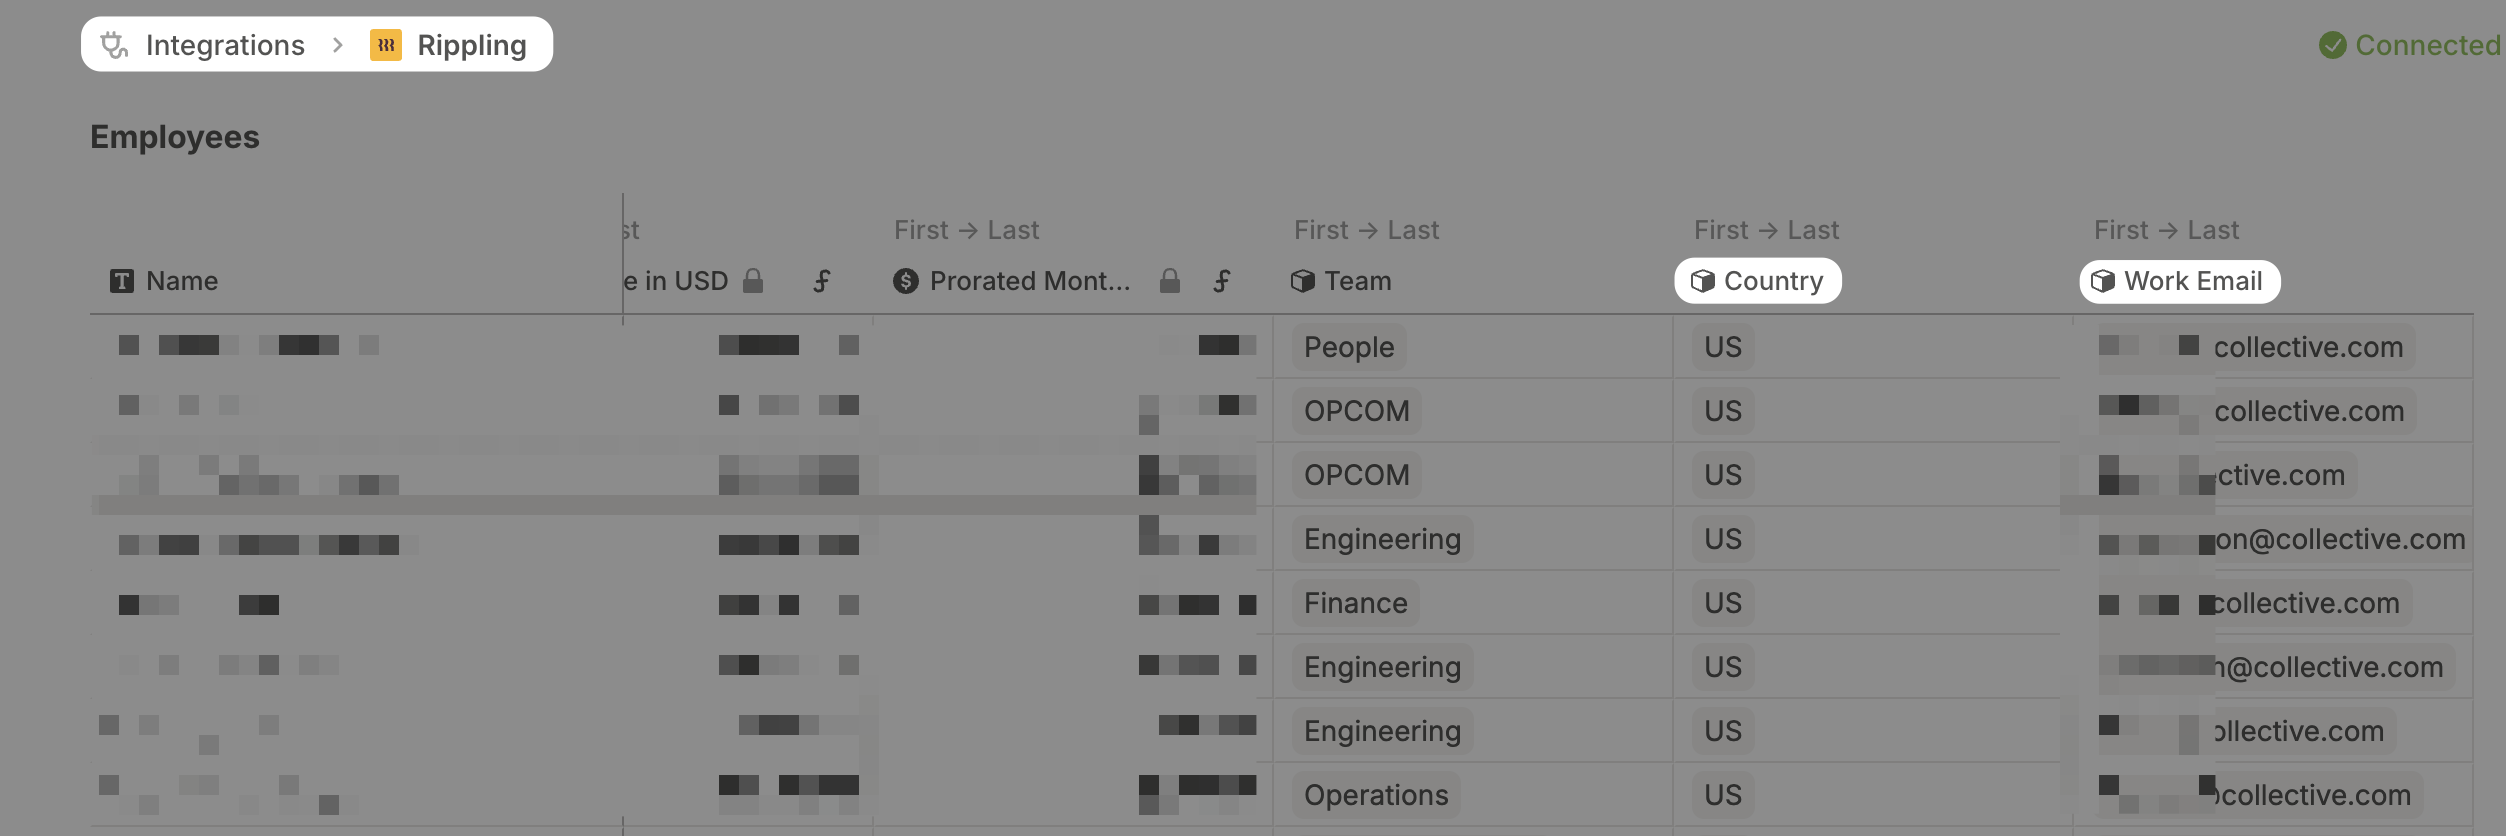
Exporting to CSV is now available to all user roles, not just Admins.
- Managers, Members, and Guests can now export models and databases.
- Any restricted fields or rows are automatically excluded.
- What you’re allowed to see is what you’re allowed to export.
This keeps your data sharing flexible, while respecting every permission rule you’ve set.