Mention anything with @. Drill in faster.
Two upgrades that make Runway reporting more robust and more responsive.
Mention anything
You can now mention almost anything in a text block:
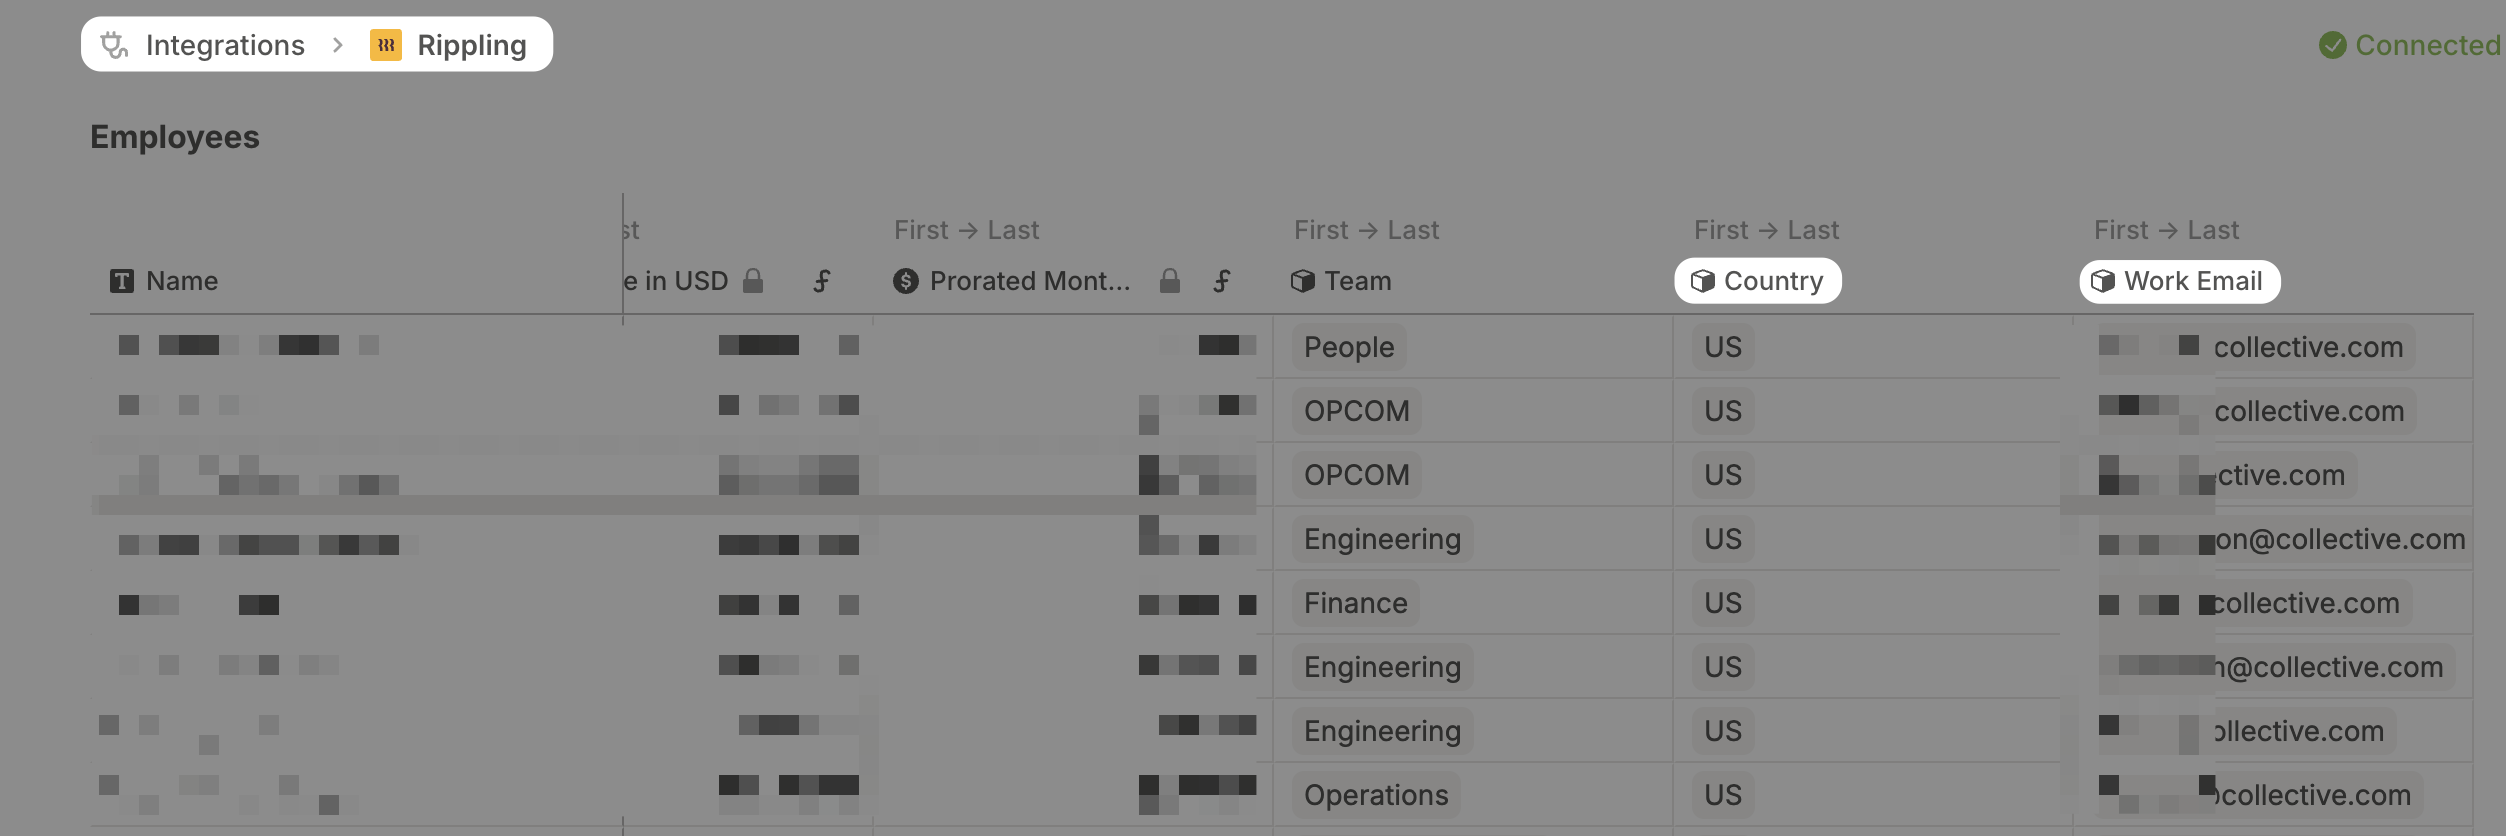
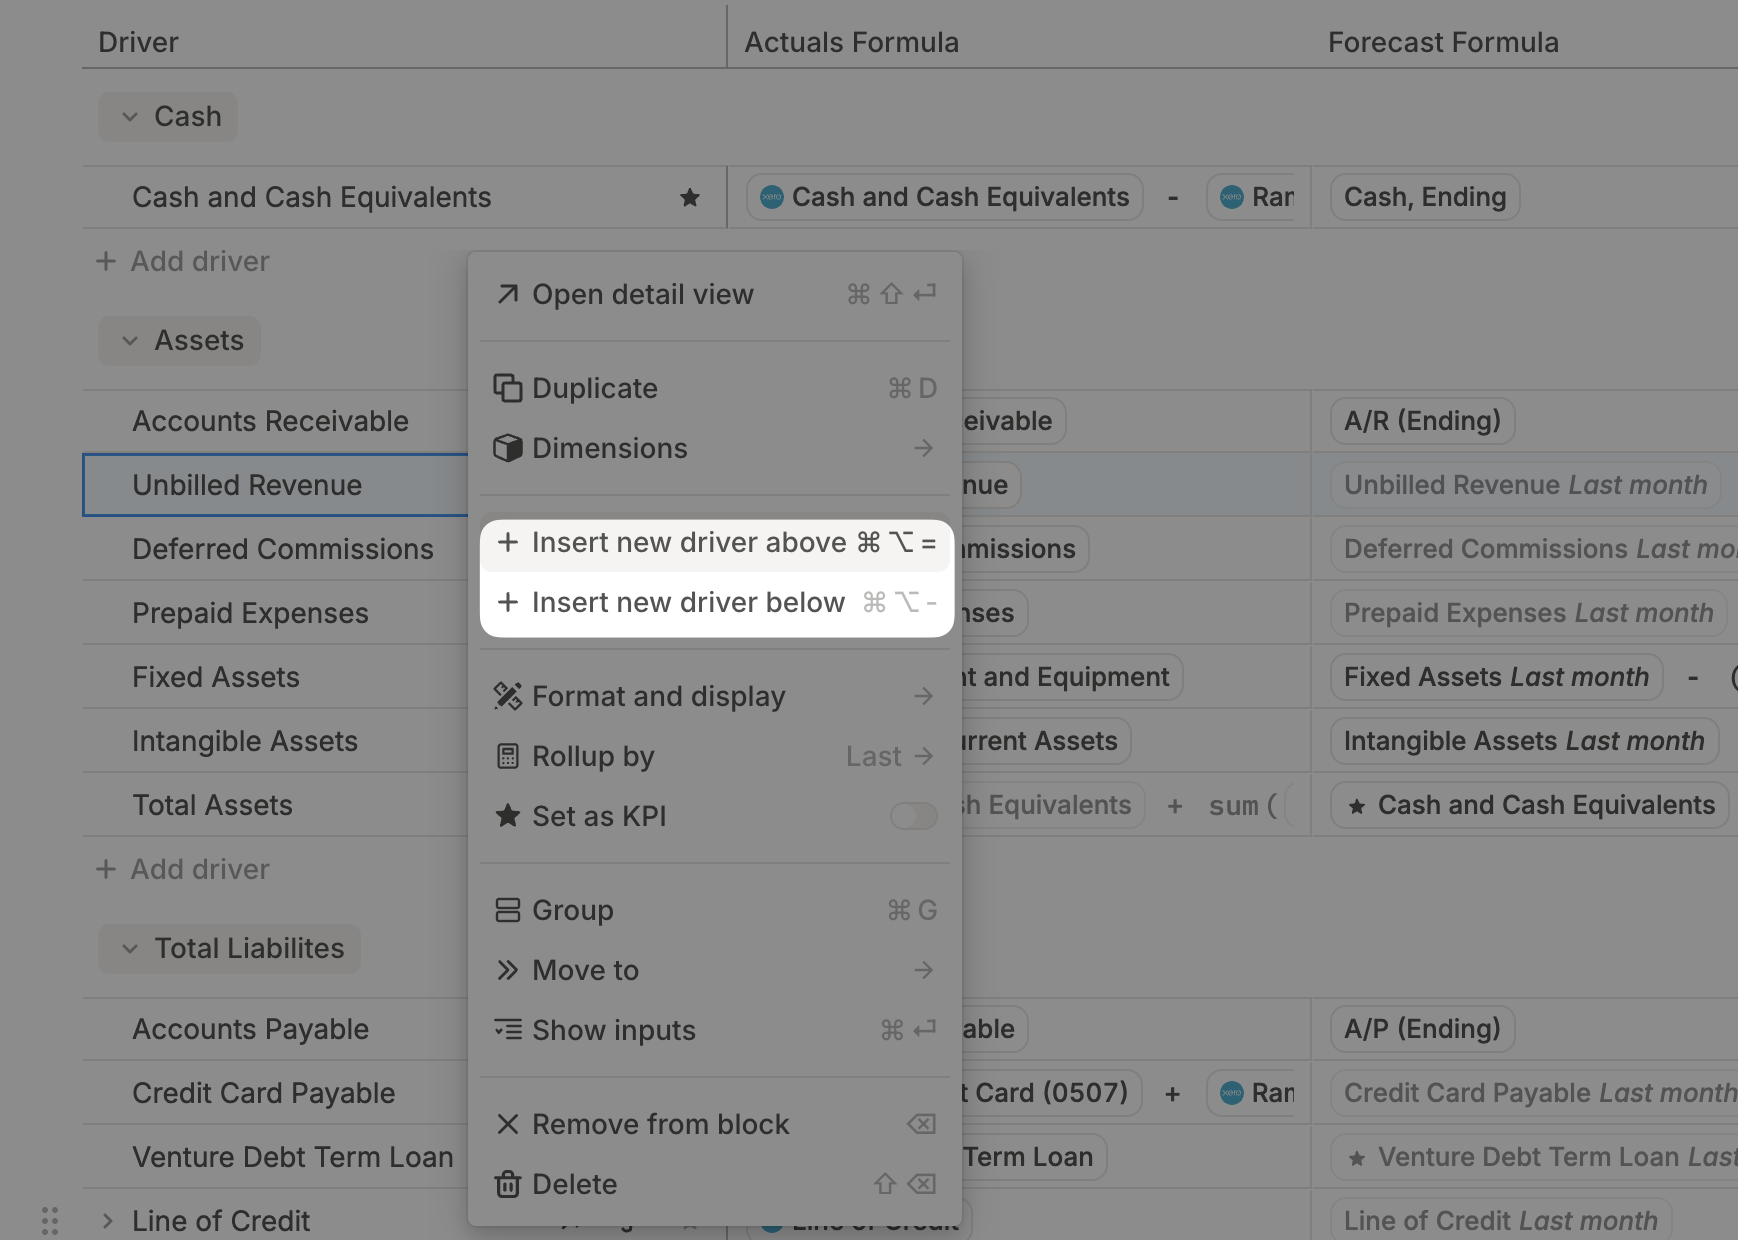
@a model, database, page, or driver- Mention specific rows from a database like key customers or teammate checklists.
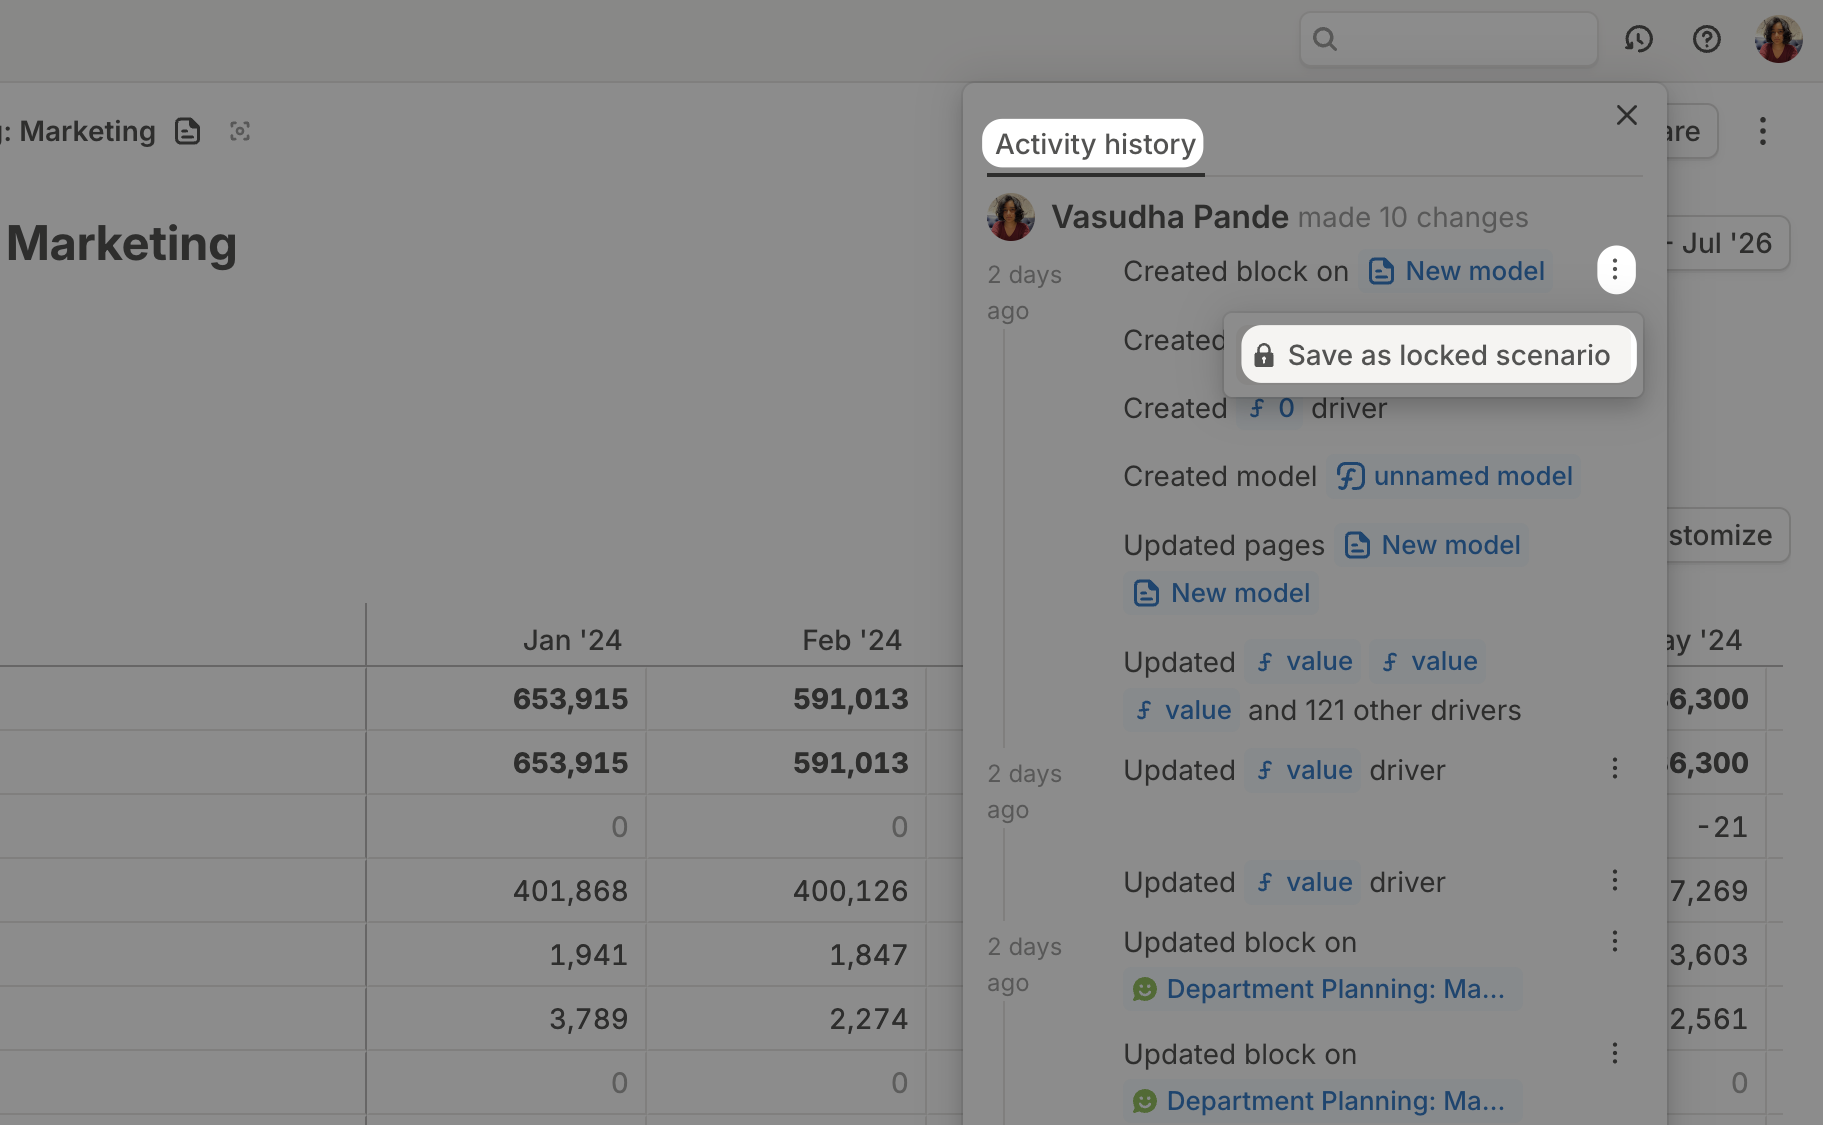
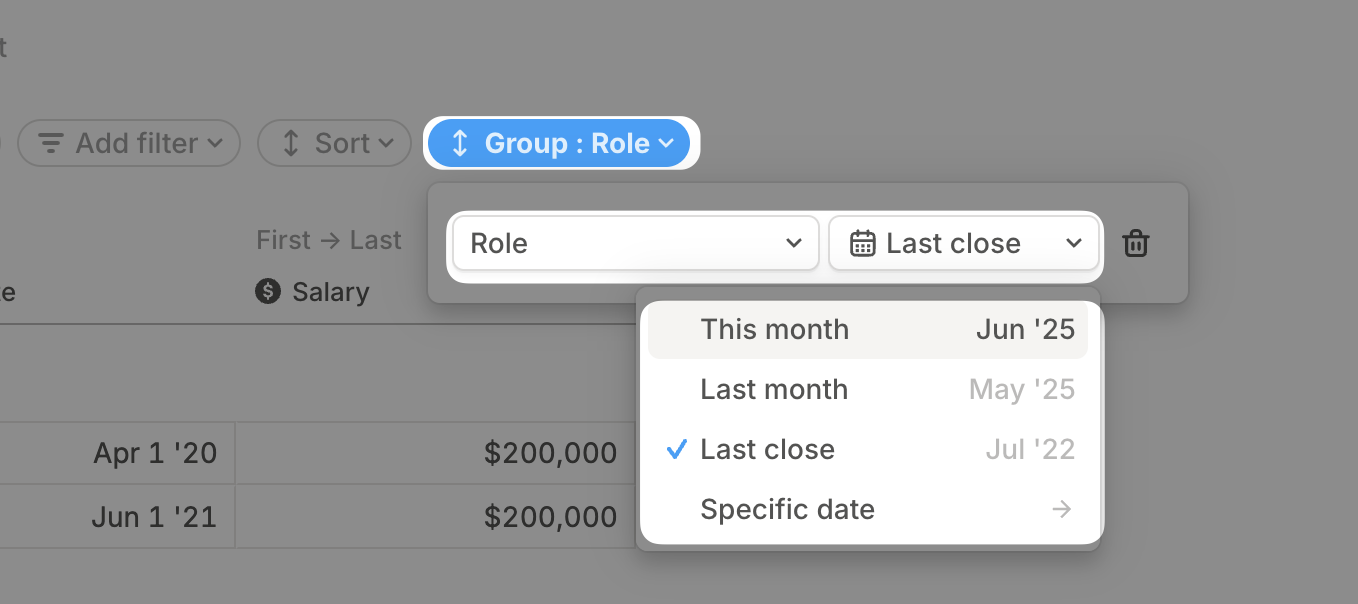
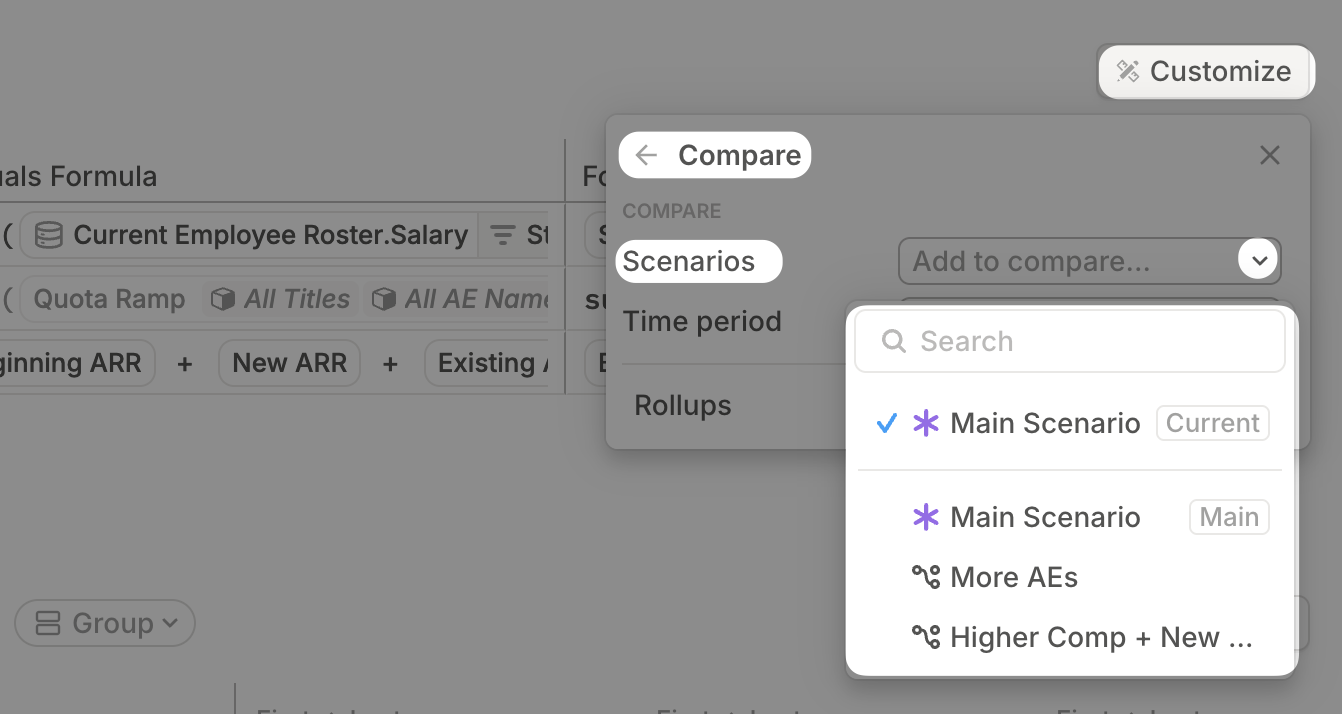
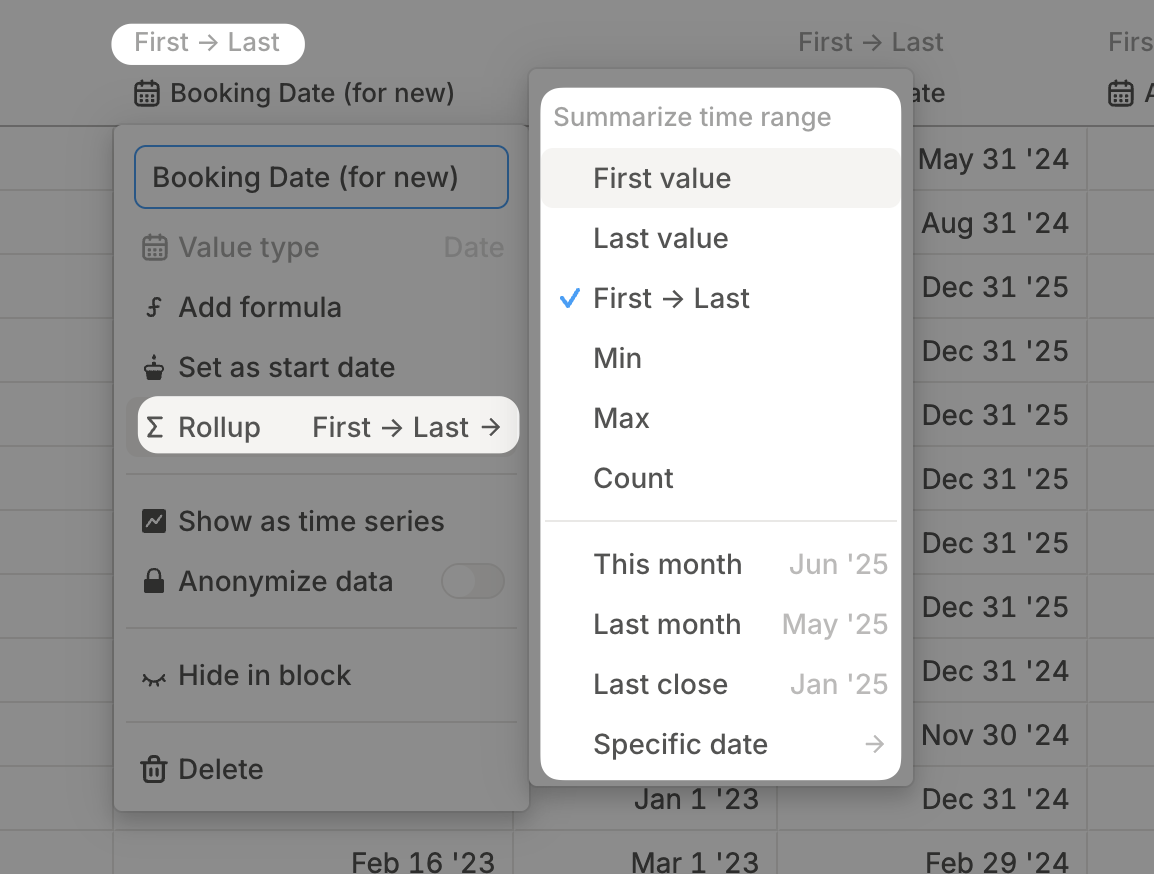
- Mention values using a relative date (like “Last Close” or “3 months from now”).
- Pages now stay up to date as time moves forward.
Mentions are clickable, live-linked, and stay accurate even if display names change.
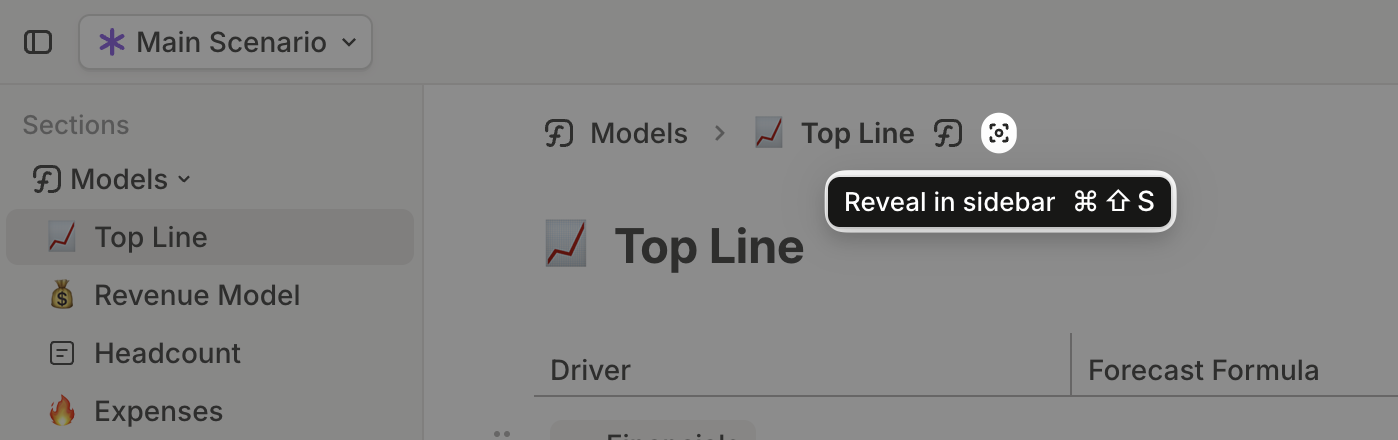
Drill-in/out faster
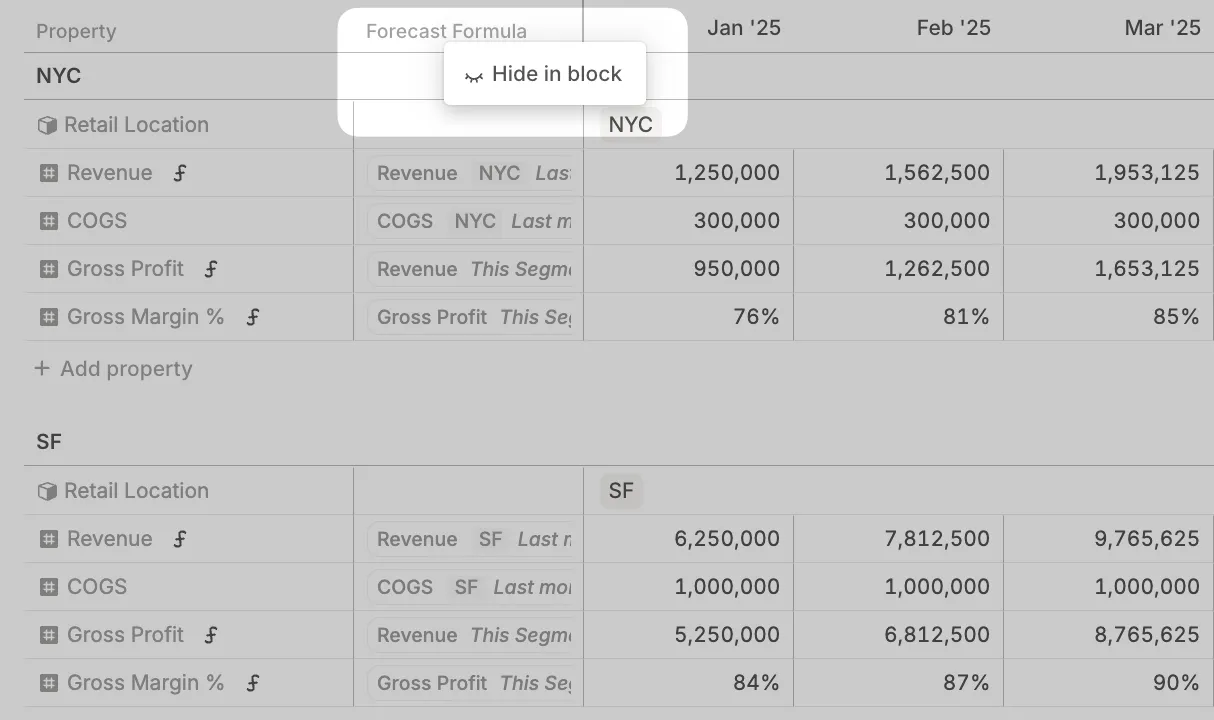
We’ve made expanding and collapsing rows faster, even for large orgs and heavy datasets.
- Drill-ins feel snappy.
- Smoother navigation across big models and databases.