Financial dashboards you can understand
Give your CEO, board, and leadership real-time visibility into the metrics that matter—without rebuilding reports every month.

Trusted by fast-moving teams
Typical financial reporting is broken
 Charts don't explain what changed
- Static reports are outdated instantly
- Board decks rebuilt every month
- Can't drill down to source data
- Stakeholders wait days for answers
Learn how CFOs stay in control
Dashboards that answer questions, not create them
Create dashboards that update automatically so when your CEO asks 'what's our burn rate,' you send a link instead of spending 2 hours pulling data.

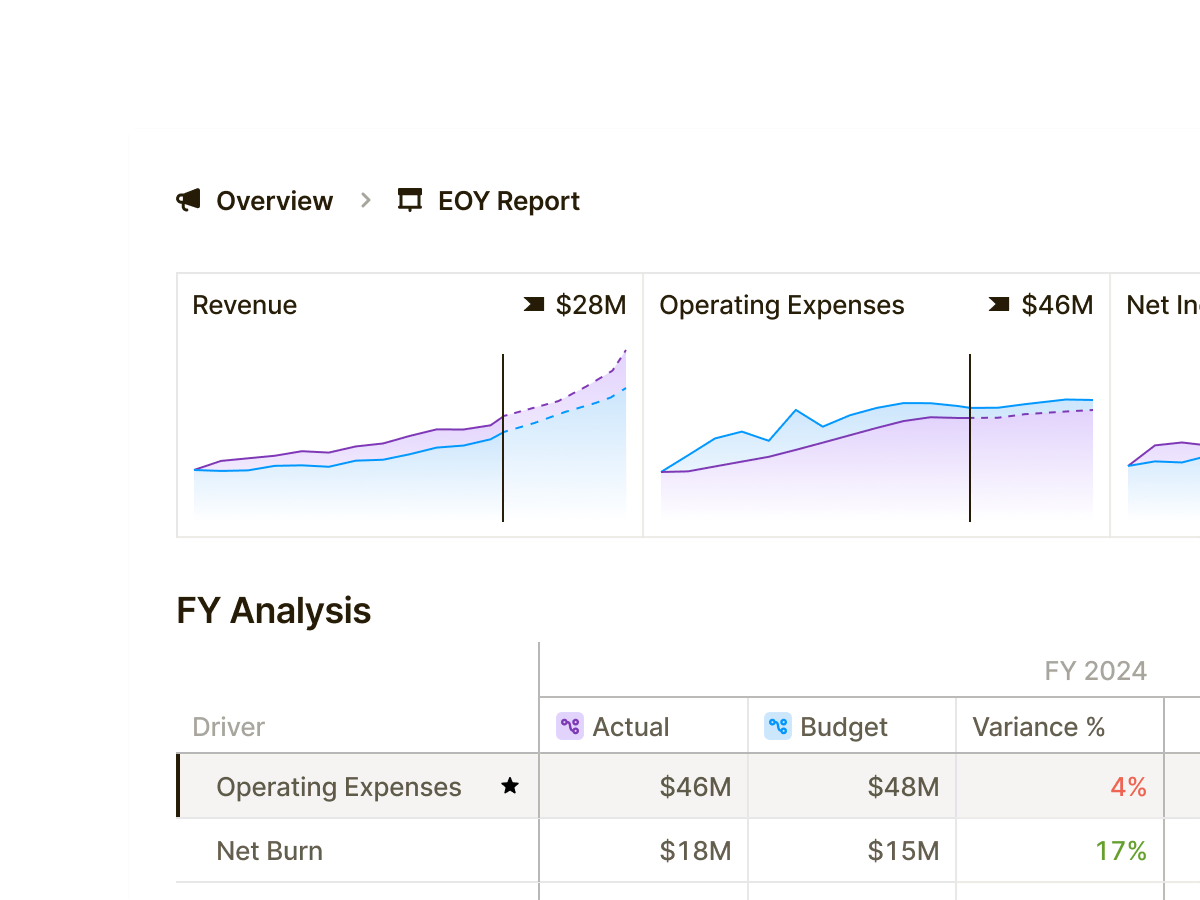
Variance analysis that updates in real time
Dashboards show actuals vs budget vs forecast—automatically. Drill down from P&L to department to vendor to understand exactly what drove variance. No manual calculations, no stale data, no rebuilding reports.
Charts that look great in any presentation
Create polished, professional visualizations with zero design work. Export charts to slides or share live dashboards with your board. Everything updates automatically—you never rebuild from scratch.
Reporting in minutes, not weeks
100% Automated board reporting
5min To create executive dashboards
Instant Actuals and variance updates
Zero Manual chart rebuilds
“Runway has allowed me to immediately reference any part of our model with ease, and to segment in any way I can imagine. We can now get down to vendor-level variance analysis.”
See it live
Book a 30-minute walkthrough to see how Runway helps you build beautiful dashboards that update automatically and answer every stakeholder question.